In Part A
of this series I showed you how to use Crystal Reports for Visual Studio 2005 with
data that resides on an IBM DB2 9 data server. That article concluded with a
reporting object in a designer (which also needed formatting). In this article,
I’ll show you how to format those default columns that aren’t sized properly
for the data which they hold, add the report to an application, and an additional
add data grid that’s bound to a DB2 data server to show all the data.
Note: To perform the steps in this article, you
need to have completed the steps in Part A.
Cleaning up the Default Report
Part A of this series left you with a report that was
complete and contained valuable information, yet the default columns sizes used
to display the data weren’t quite right. You can use the Main Report Preview
view (located at the bottom left of the report designer) to see how your
application will render any report you create in Visual Studio. You can switch
between this view and the designer view (called Main Report – the
default view) to resize and format (among other things) your report.
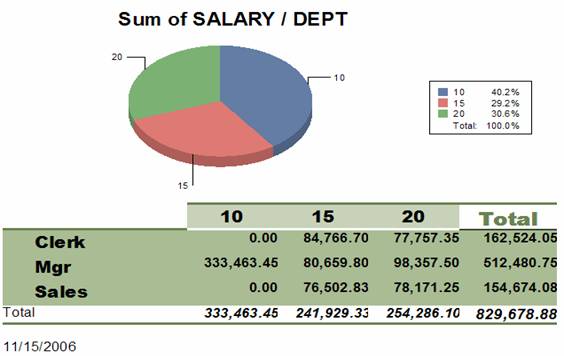
You can see when I switch to the Main Report Preview I’ve
got some display issues – the default display controls for the data aren’t
sized correctly:
Use the Main Report view to resize some of these
columns. For example, I can see based on the previous figure that each row
label in my cross tab report needs to be adjusted vertically, while some of the
salary values could benefit from a horizontal adjustment. In addition to this,
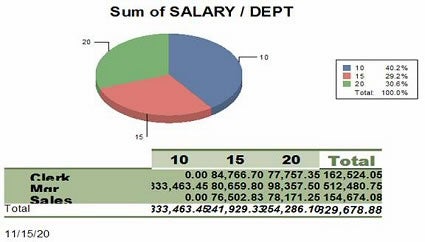
the default size for the default date label is truncated (for example, the year
2006 displays as 20 in the preview).
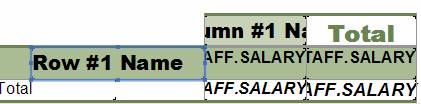
You can change the size of any field by clicking on that
field’s control and resizing it (note the blue binding box):
Note: Different parts of a Crystal Report
can reside on different layers which can provide you a rich set of design time
options when creating reports. However, this topic is outside the scope of this
article. For this article, take note of the location of the Print Date
control (shown below) which is used to insert the date the report is generated.
The default sizing for this control isn’t correct either. You adjust the size
of the Print Date control in Section2 (Page Header) – a different
layer:
![]()
When you are finished adjusting the display properties of
your cross tab report, it should look like this: