
In my latest articles, I’ve been writing about the IBM Rational Data Architect (Rational DA) integrated development environment (IDE), a tool that’s specifically designed for those involved in data server design and schema evolution. So far, I’ve shown you how to add a database connection, which becomes the basis from which all of your work is directed. In addition, I detailed how to build SQL statements using the SQL builder and the SQL editor, along with a bunch of really cool features that minimize design time errors and lead to faster and more robust deployments. In this article, I want to introduce you to another feature available from the Database Explorer view: storage diagrams.
The Database Explorer view: home of storage diagrams
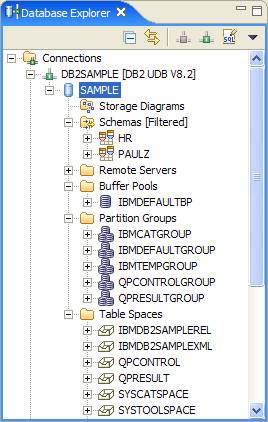
Once you have an active database connection, you can do a lot of things with the Database Explorer view aside from just creating SQL statements. For this article, I assume you have an active database connection to the SAMPLE database and your Database Explorer view looks similar to the following example:
Storage diagrams
The storage diagramming feature is a useful tool that’s available directly from the Database Explorer view. Storage diagrams, as their name suggests, are visualizations of the underlying storage used for your physical data objects. Rational DA allows you to work with many vendors’ databases (including their storage objects), but you can only create storage diagrams for DB2 for z/OS, and DB2 for Linux, UNIX, and Windows data servers.
To add a storage diagram that illustrates the storage model for your database, perform the following steps:
1. Right-click Storage Diagrams and select Add Storage Overview Diagram. The Select Elements window opens.
2. Select the table spaces you want the diagram to include in the Select Elements window and optionally include more detailed information in the diagram such as related tables, buffer pools, and partition groups, by selecting their corresponding check boxes:
Click for larger image

In the previous figure, you can see that I chose to visualize the main non-system default table spaces that are automatically created when the SAMPLE database is created using the db2sampl –xml command. In addition, by selecting the Include related tables and Include related buffer pools check boxes, I include these objects in my storage diagram but not related partitioned groups (because this is a non-partitioned database).
Note:
Even when the Database Partitioning Feature (DPF) is not being used to create a partitioned database environment, the underlying architecture is still configured for it. This is why partition groups show up in the Database Explorer view as an optional component in any associated storage diagrams.
Based on these options, Rational DA creates a storage diagram that looks like this:
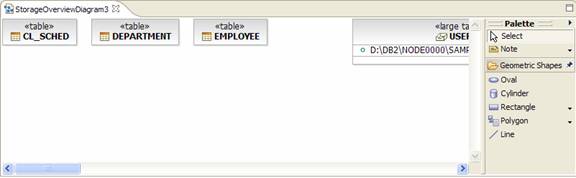
You can see that the default layout that Rational DA uses when a large number of objects are included in a storage diagram can be pretty hard to read. Thankfully, Rational DA provides some good features to help you work with larger diagrams.
First, you can use the Outline view. (If you don’t see it, open it by selecting Windows->Show View->Outline, or just press Alt+Shift+Q,O). The Outline view for this storage diagram is shown below:
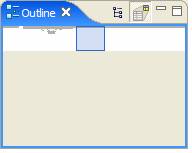
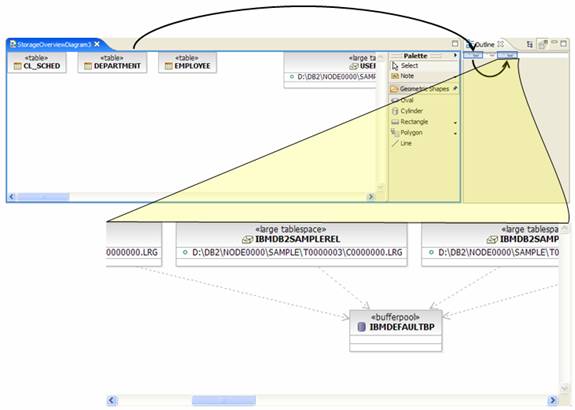
In this mode, the Outline view can be used as a magnifying glass for the designer canvas. Simply move the viewer box over the shaded lines (those are objects in the storage diagram) and watch the designer canvas as it shows the objects in the Outline view’s magnifying box:
The Outline view also has a perspective that lets you navigate the objects in a hierarchical tree. You can change to this perspective by selecting the Node icon (the one to the left of the magnifying perspective), as shown below.
The hierarchical view shows the same information but in a different format, as shown below:
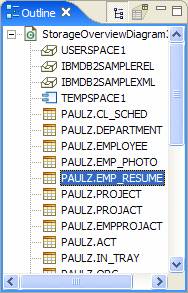
Personally, I like to work in the hierarchical view because it allows me to see the names of all the objects in the diagram, and when I find one I want more details on, I simply click it and the canvas automatically navigates to it. This saves having to scroll around in the magnifying view until I stumble on the object I’m interested in. You’ll develop your own preferences that are related to your schema, and indeed the magnifying view provides some benefits when working with very large diagrams, but the point is you have the flexibility to choose the visualization method that’s best for your schema.
3. Close the visualization diagram by clicking the ![]() button in its name tab:
button in its name tab:
![]()
4. Using the previous steps outlined in this article, create a new storage diagram that doesn’t contain as many objects. To make things easier, select a single table space, and preferably one that doesn’t have a lot of objects in it. For this example, you might want to use the following data definition language to ensure that you have a table space with a small number of objects.
CREATE LARGE TABLESPACE DATABASEJOURNAL
CREATE TABLE EMPLOYEEDJ LIKE EMPLOYEE in
  DATABASEJOURNAL
CREATE TABLE DEPARTMENTDJ LIKE DEPARTMENT in
  DATABASEJOURNAL
Using the previous DDL should produce a storage diagram that looks like this:
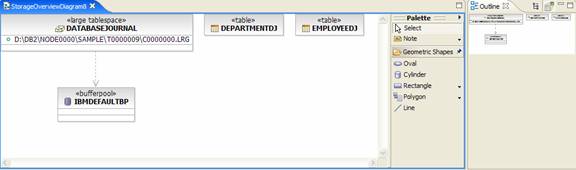
Note:
You might have to select Storage Diagrams->Refresh to refresh the schema cache after adding objects to your database connection to make them show up in the Database Explorer view.
5. Select each object in the new storage diagram, and click Properties to see specific details on each object:
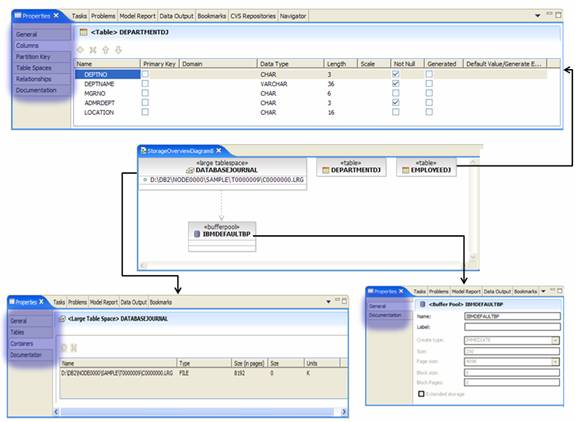
In the previous figure, you can see that the properties of each object vary and are categorized by Rational DA using sub-tabs (shown highlighted). Explore these tables and their associated properties to get a sense of all the information that you can find out about the storage objects in your database using Rational DA.
6. Select any object in your storage diagram and right-click to see the storage diagram object’s pop-up menu:
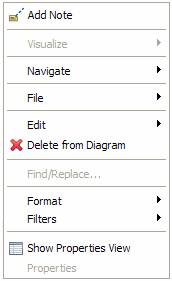
This pop-up menu is the same for any object you select in a storage diagram and contains the following options:
Add Note – Allows you to add a note describing the selected object in the storage diagram. Unlike the Property tab’s Documentation tab, this information is placed on the design canvas. For example:
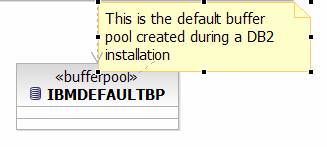
Before you enter the text for a note, you should size it using its control handles (the black squares in the previous figure). The note text you type automatically fits within the defined box. Pressing Enter in a note box doesn’t result in a carriage return; rather it tells Rational DA that you have finished typing the note.