
In my latest articles, I’ve
been writing about the IBM Rational Data Architect (Rational DA) integrated
development environment (IDE) that’s specifically designed for those involved
in data server design and schema evolution. So far, I’ve shown you how to add a
database connection, which becomes the basis from which all of your work is
directed. In addition, I’ve detailed how to build SQL statements using the SQL
builder and the SQL editor, and described a bunch of really cool features that
minimize design time errors and lead to faster and more robust deployments. I’ve
also explained how to visualize your database storage using a storage diagram.
In this article, I detail the rest of the features in the Database Explorer
view.
To follow along with this present article, you should have a
connection to the SAMPLE database (created by entering the db2sample –xml command
from your operating system’s command line processor) and have a live connection
to it from the Database Explorer view.
Database Explorer view actions from a database object
You can perform a number of
actions from a database object in the Database Explorer view. You can see these
options by right-clicking your database connection:
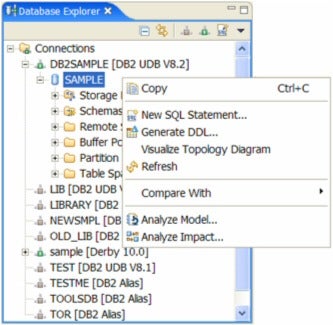
The actions that you can perform from a selected database are:
-
Copy – Copies a database connection’s objects into
the Data Model folder of a Data Design project located within the Database
Project Explorer view. (You will learn more about Rational DA projects in
subsequent articles in this series.)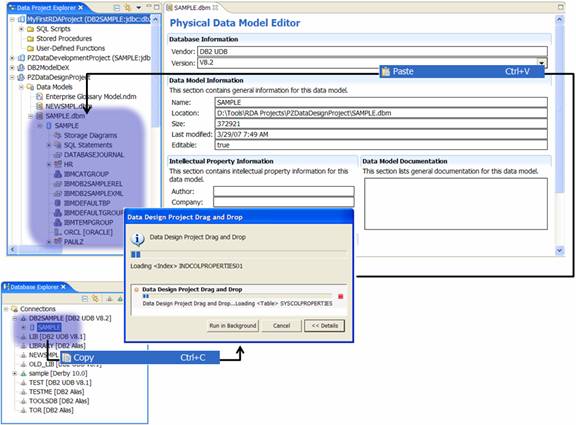
In the previous figure, you can see
that the SAMPLE database connection was copied and pasted into the PZDataDesignProject
and can be viewed within the Data Model folder. -
New SQL Statement – As detailed in a previous
article in this series, invokes the SQL editor or SQL builder so you can
create an SQL statement. -
Generate DDL – Generates the data definition language
(DDL) required to recreate the selected object. When you select this option
from a database, you can choose from among several objects and supporting
business rules available to include in the generated DDL.In the following example, you can
see that I’ve instructed Rational DA to generate the DDL with fully qualified
names for the database and its existing tables. I’ve specifically left out other
objects in the schema, and business rules such as referential integrity
constraints and primary key constraints: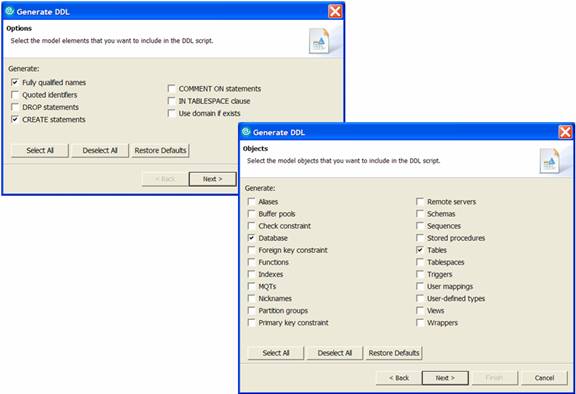
Rational DA gives you the option to
run the generated DDL immediately or place the entire DDL into a designated project
as a script file: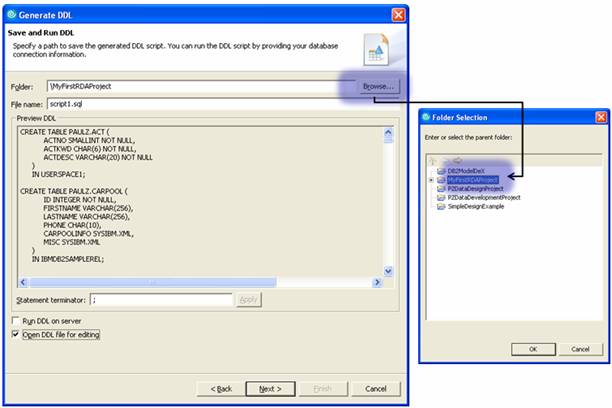
In the previous figure, you can see
that I selected a project in which to place the generated DDL script file using
Browse and a corresponding Rational DA project. (I used the project I showed
you how to create in a previous
article.) When you have specified a project and its path, click Next, verify
the scripting actions you requested in the Summary window, and click Finish.All the generated DDL is placed in
the selected project’s SQL Scripts folder as a script file called script1.sql:
-
Visualize Topology Diagram – Creates a read-only
visualization diagram of the peer relationships among objects in your data
server (for example, schemas and tables). You can drill down into these objects
by clicking to
to
expand each object tree: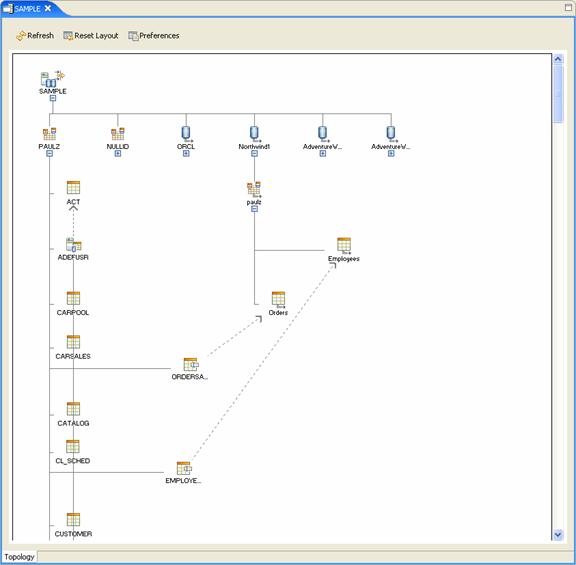
You can see in the previous figure
that the generated topology diagram includes federated tables as well as
regular tables. For example, the Northwind1 object is actually a
federated nickname that represents a table that resides in a Microsoft Access
database, where two other tables, called ORDERS and EMPLOYEES, reside.A dashed line in this diagram shows
peer relationships between source and target objects. A peer relationship line
can show connections between nicknames (as is the case above), tables, views,
materialized query tables (MQTs), and table aliases.If you right-click an object in a
topology diagram, you see a pop-up menu with the options that you can perform
on that object. For example, you can hide a table or schema from the topology
diagram or quickly navigate to its location in the Database Explorer view.Note that if the topology diagram
is very large, you can navigate it using the Outline view, as discussed
in my
previous article on storage diagrams. In addition, note the filtering icon
( )
)
in the top-right corner of the database name in this topology diagram. This
icon indicates that the database has a filter applied to it. (In a previous
article in this series, I showed you how to apply schema filters to
database connections in the Data Explorer view.)You can use the Preferences button
(shown at the top of the diagram in the previous figure) to configure the way
the topology diagram looks in Rational DA.When you click this button, the
following window opens: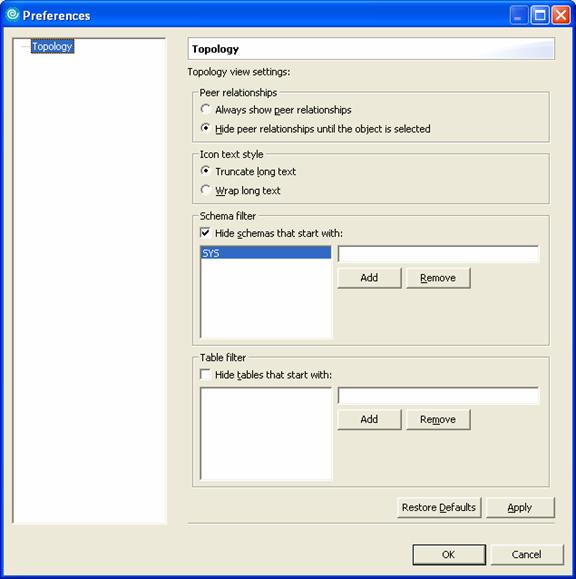
Use the Peer relationships controls
to show or hide relationships between objects in the database. For example, Always
show peer relationships (selected by default) shows the relationship lines between
related objects (as shown in the topology diagram used in this article). Hide
peer relationships until the object is selected hides the dashed lines until
you select the object.Use the Icon text style controls
to set how names appear in the topology diagram. Truncate long text,
selected by default, shortens long object names, as shown in the sample
topology diagram. Wrap long text shows the full names of these objects: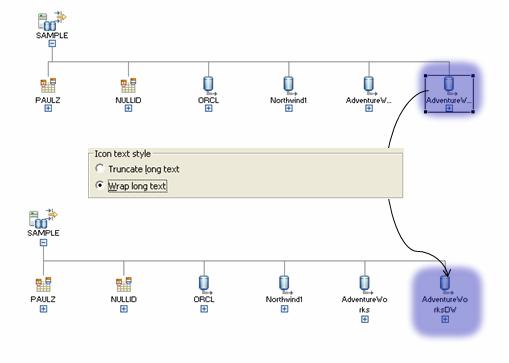
The rest of the fields in this
window can be used to filter the schema (if it isn’t already filtered) and the tables
in the diagram. -
Refresh – Updates the objects shown in a view. For
example, when you create a new table in the database, this option refreshes the
objects in the Database Explorer view so that the new table appears.The Refresh option exists on
every folder’s pop-up menu in the Database Explorer view. If you select it from
the pop-up menu of a database object, it refreshes all the database’s folders.
In contrast, if you select this option from a single folder, only the objects
in that folder are refreshed.