


Every DBA needs to keep an eye on the performance of their
SQL Server instances. They need to do this to make sure their instances are
performing as expected. Performance of an instance can change over time due to
increased use, application changes being implemented, loading of more data, or
a number of other things. If a DBA doesn’t do proactive monitoring then
eventually they will get that call from one or more customers with complaints
about performance. To help with monitoring SQL Server a DBA can build a
homegrown solution, or purchase one of the many different commercial products
available. This article will look at one of those commercial products from
Red-Gate known as “SQL Response”.
What is SQL Response?
SQL Response is a tool that allows DBAs to monitor a number
of different SQL Server instances simultaneously. For each instance monitored,
a number of different factors are checked. The items that are checked are
known as Alerts. Alerts fall into three different categories: Server Alerts,
Job alerts, and Process alerts.
The SQL Response tool has a dashboard type interface. This
interface displays the different alerts that have reached their threshold and
have fire. Each event is categorized by a different color, with red for high,
yellow for medium, and blue for low. This kind of interface allows a DBA a
quick way to identify the issues that need to be looked into first, and those
that are not as critical.
Version 1.0 of SQL Response came out in September. By the
first of November, they had their first update, version 1.1. This quick
turnaround in providing an update doesn’t mean a bunch of bugs were found, but
instead shows how responsive Red-Gate is in providing fixes and enhancements to
their products. Even though SQL Response is still only a version 1 product, it
still is a very feature rich version.
Using SQL Response
SQL Response runs from a monitoring server and reaches out
to SQL Server machines and fires alerts when it notices a problem. These
alerts are stored in an Alert Repository. The SQL Response monitoring server
needs to be on a server that is available all of the time and can connect to
the SQL Server machines you want to monitor. When the SQL Response monitoring
server is down SQL Response will be unable to monitor any of your SQL Server
instances.
The first thing you need to think about before installing
SQL Response is how you are going to use it to monitor your servers. The
machine that runs SQL Response and houses the repository does all of the heavy
lifting for SQL Response. This SQL Response machine will be very busy
monitoring servers, therefore Red-Gate recommends that if you are going to
monitor a number of servers that you consider having a standalone machine for
that runs SQL Response and houses the alert repository.
SQL Response has two different configurations for
installing the SQL Response client software and the Alert Repository. I think
the following “Alert Repository” screen shot is worth a 1000 words about the
two different options:
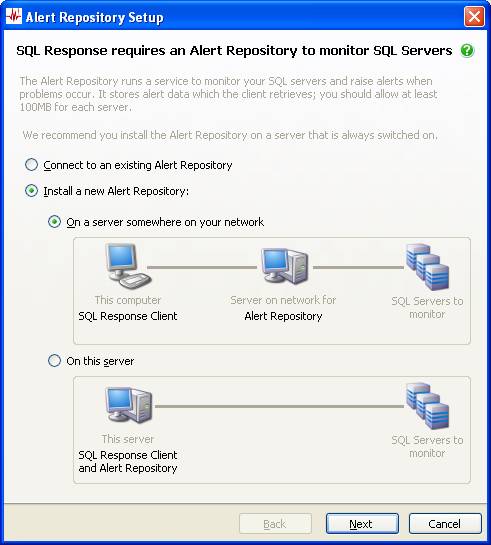
The first method of configuring the repository is to setting
it up on a server other than the machine that contains the SQL Response client,
where as the second method is to install it on the same servers that the SQL
Response client is installed. You need to determine which of these options
work best in your environment. If you are planning to have multiple DBA’s
monitoring the alert that fire, then possibly the first option might be the
best for you.
As already stated, Red-Gate recommends that the SQL Response
monitor and alert repository reside on a different server than the SQL Servers
instances you are monitoring, especially if you are monitoring a large number
of servers. The actual alert repository is a SQLite database. More
information about SQLite can be found here: http://www.sqlite.org.
It is recommended that you don’t monitor more than 50 instances with a single
installation of SQL Response.
Once you have configured where the alert repository will
live you can start monitoring servers. Below is a screen shot of the main SQL
Response window you will see when you bring up the SQL Response client for the
first time:
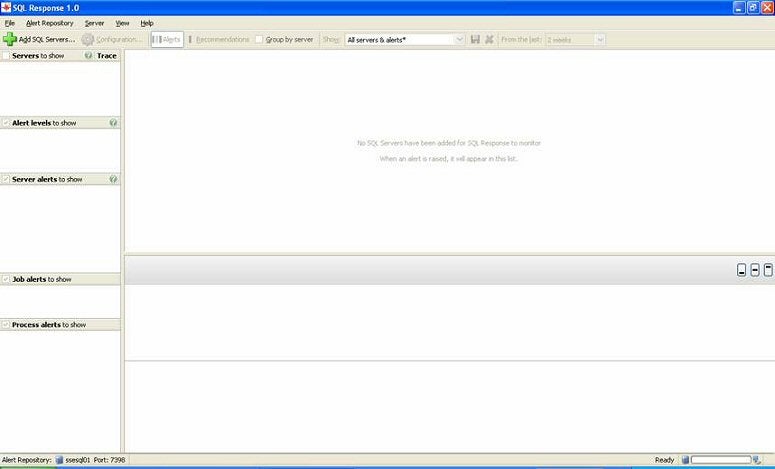
To start using SQL Response to monitor SQL Server instances
you need to identify the instances you want to monitor. The tool makes it
really easy to identify the instances you want to monitor. All you need to do
is click on the big green plus sign (+) to identify new
instances to monitor. This brings up an “Add Server” dialog box:
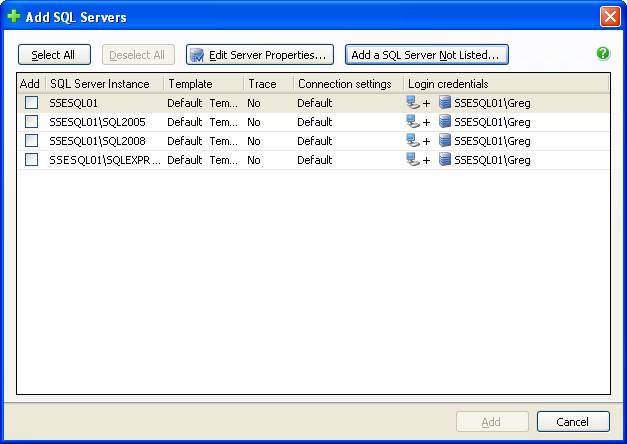
Here you can see that SQL Response has detected a number of
SQL Server instances it can see. To setup SQL Response to monitor an instance
all you have to do is just check the instances you what to monitor by checking
the appropriate “Add” checkbox. If an instance you want to monitor is not listed,
you can use the “Add a SQL Server Not Listed…” button to add those SQL Server
instances.
When you are adding a new SQL Server instance you can either
take the defaults for how this instance is monitored, or you can specifically
set the properties for how SQL Response will handle monitoring that instance.
If you want to configure how the instance will be monitored you would click on
the “Edit Server Properties” button on the “Add Servers Dialog” window. When you
click on this button, the following screen is displayed:
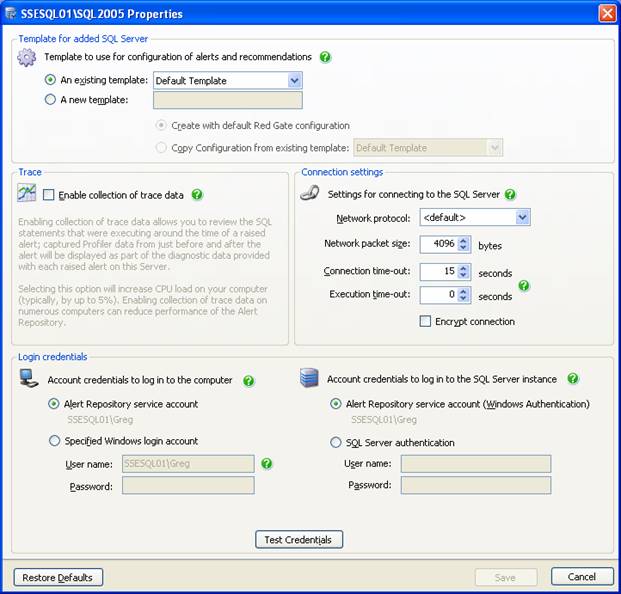
As you can see can see you have a number of different
options for configuring each of your servers, like want protocol or login
credentials you would like SQL Response to use. Once you have added instances
to SQL Response, it starts monitoring those instances.
SQL Response uses a number of different alerts to monitor
your SQL Server instances. SQL Response uses these alerts to identify when
something is out of the ordinary, and takes the appropriate action when the
threshold for one of these alerts is exceeded. As I already mentioned, SQL
Response alerts fall into three different categories: Server, Job, and
Process. Here is a list of the different alerts that SQL Response has by
category:
Server Alerts:
- Cluster failover
- Computer login failure
- Computer unreachable
- CPU utilization unusual
- Low disk space
- Low physical memory
- SQL Server login failure
- SQL Server unreachable
Job Alert:
- Job did not start
- Job duration unusual
- Job failure
Process Alert:
- Blocked SQL process
- Database state change
- Long Running query
- SQL Agent not running
- SQL deadlock
- SQL Server error log entry
SQL Response uses a color-coding scheme to identify the
difference in importance of the different alerts. There are three different
colors: Red, Yellow, and Blue. Red is a high alert, which is something you
should look into right away. Red alerts are things like “SQL Server
unreachable”, or “CPU utilization unusual”. A yellow alert is a warning alert
for things like “Low on physical memory” or a “Job failure”. Blue alerts are low-level
alerts like “Long running query” or “Job duration unusual”. These different
colors allow a DBA to quickly focus in on those alerts that need immediate attention.
You can configure the level (color) and threshold (the value) for when an alert
is fired. Here is a screen shot that shows the different options for
configuring the “Job duration unusual” alert:
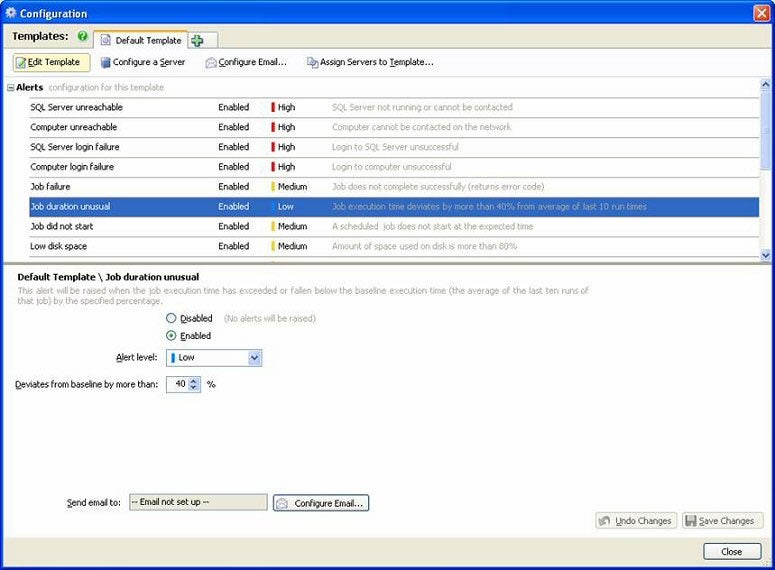
Here you can see that you can disable this alert, change the
alert level to a different color, as well as change the baseline for when the
alert is fired. You can also configure SQL Response to send you an email. In
order to do this you must first configure SQL Response to know which SMTP
server you would like to use for sending mail. You can do this by clicking on
the “Configure Email…” button on the above window.
When alerts are fired, they are displayed on the main SQL
Response page. Here you can see the alerts that have fired for my install of
SQL Response:
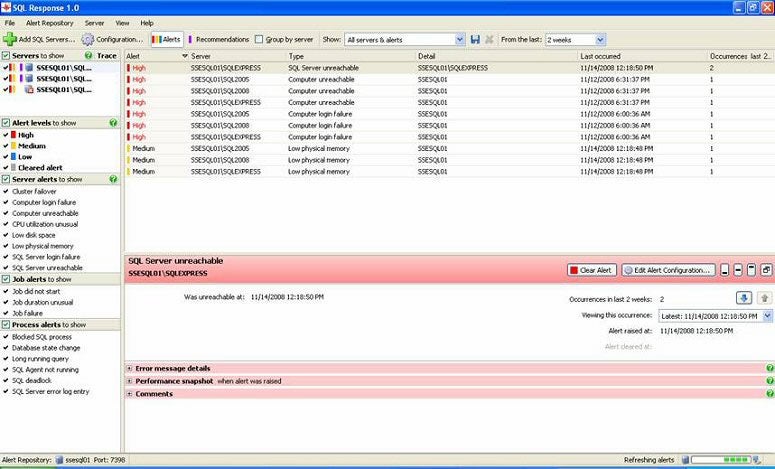
From this main page, you can drill down and get additional
information on any of the alerts that have fired. Here is a screen shot of
what I get on my machine when I drill into one my medium alerts (yellow in
color) for “Low physical memory”:
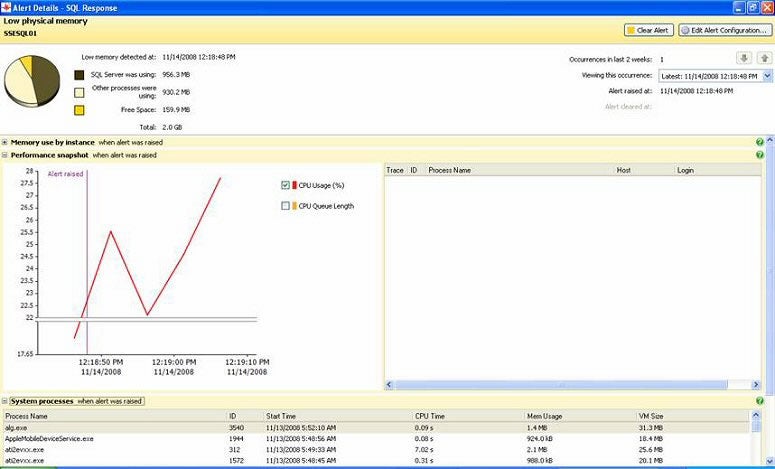
From these “Alert Details” reports, you can get a better
picture of what was happening during the time when an alert was triggered.
This additional information can help you identify the cause of the problem, and
hopefully will help you determine how to prevent the alert from occurring
again.
SQL Response not only monitors for events that are out of
the ordinary, it also reviews your servers and databases and makes
recommendations. Recommendations are useful to help you make sure your
servers are being managed appropriately. Monitoring recommendations and
performing the appropriate actions when recommendations are identified improves
the availabilities and recoverability for your instances. Here is a list of
recommendations that SQL Response looks for when scanning servers for
recommendations:
- Data files has excessive free space
- Fragmented index
- Full backup overdue
- Integrity check overdue
- No backup exists for database
- Page verification is off
- Transaction log has excessive free space
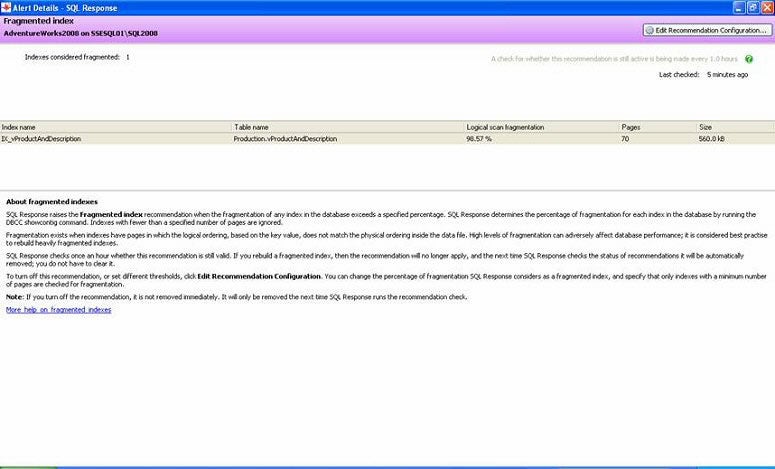
Below is an example of a Fragmented index recommendation on
my AdventureWorks2008 database:
SQL Response does not require anything to be installed on
any of the servers that are running your SQL Server instances. All monitoring
is done from the server that contains the Alert repository. The Alert
repository server reaches out and monitors each SQL Server instance remotely.
Red-Gate states that there is about a 1 to 2 % CPU hit on the servers being
monitored per instance and around 200-300 MB of disk space to store 6 months
worth of alerts for each instance (note I was not able to substantiate either
one of these figures). If you change the default thresholds for alerts then
the amount space consumed will vary. I suggest that you monitor your servers
for a few weeks and then review the space usage. Based on how much space has
been used you can determine whether you need to change the purge statistics
setting. The default for deleting old alert information is six months. You
can use the Alert Repository option to change the length of time that might be
appropriate for your environment for retaining your alerts. The disk space
usage information can be found by using windows explorer. The default location
for the repository is the “C:\Documents and Settings\All
Users\Application Data\Red Gate\SQL Response 1” directory. This location is identified
when you install SQL Response.
Worth Monitoring
SQL Response was an easy tool to install and get running.
Within minutes I was up and running and finding out useful things about my
servers that I never knew. I was pleased to find that I could use my SQL Tool
Belt license to use SQL Response monitor one SQL Server instance. I only wish
I could have monitored a few more with the tool belt license. For a version 1
product, I was very impressed. If you are looking for a simple to use, easy
to configure monitoring tool you should give SQL Response a test-drive using
Red-Gate’s 14-day trial of SQL Response.