


In my prior article (Introduction to the SQL Server Data Profiler Task – Part 1) I introduced you to the SSIS Data Profiling Task. In that article I give you a quick tour of how use the Data Profiling task. In this article I will explore using a few of the different Data Profiling profiles to allow you to understand the shape of your data and improve the quality of the data in your database.
Does Your Data Conform to a Known Shape?
When you are loading new data into your database, one of the tasks you probably take on is reviewing the data to make sure it conforms to some business rules. Part of this review process is rejecting single records or a complete dataset if it doesn’t conform to a known shape. By known shape I mean you look at a specific column or set of columns and validate that all rows meet some criteria, like all transaction dates must be for the current month, or all the values in a specific column must be either a 4 or 5 digit number.
In this section I will be showing you how to use the Column Statistics profile to validate a data column against a business rule. For the purpose of this demo, let’s assume you get a number of Monthly Sales data file for the prior month. Your business rule is to reject any Sales data feed that has a transaction date that is not within the prior month.
In order to demo the Column Statistics profile to validate this business rule I need to first build some test data. I used the script in Listing 1 to create my test data.
USE   tempdb;
go
CREATE   TABLE Sales (
TransactionID   int,
TransactionDate   date,
SalesAmount   money
);
INSERT   INTO Sales VALUES
        (1,'9/1/2012',10.99),
        (1,'9/2/2012',12.99),
          (1,'9/4/2012',7.87),
          (1,'9/8/2012',109.24),
        (1,'9/10/2012',14.04),
        (1,'8/1/2012',15.99),
        (1,'9/12/2012',31.27),
        (1,'9/14/2012',19.84);
Listing 1: Column Statistic Profile demo data
If you review the data that was inserted into the Sales table that was created in Listing 1 you will see that most of the records have a TransactionDate in the month of September 2012, but there is one record that has a TransactionDate value in August 2012. For the purpose of this article, assume that the Sales table was the table created on the first day of the month of October, and based on my business rule should only have transactions for the month of September 2012.
To verify that all records in the table Sales have a TransactionData in September 2012 I will be using the Column Statistics profile. To use this profile I first start up Visual Studio and create a new SSIS package. I then drag the Data Profiling Task from the toolbar over the Control Flow pane of my new package. Upon doing that my SSIS packages looks like the image in Screen Shot 1.
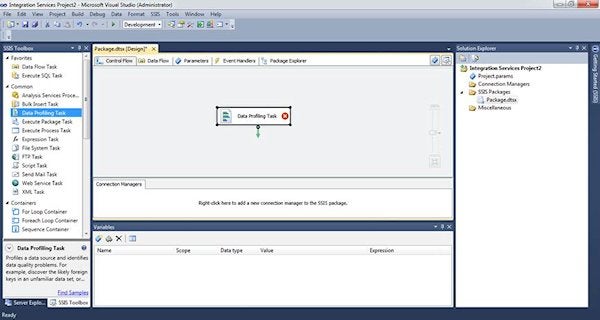
Screen Shot 1: New Data Profiling Task on Control Flow pane
The next step is to configure my new data profiling task so it will profile the data in the tempdb.dbo.Sales table, the data I created in Listing 1. To start this configuration process I just double click on the Data profiling task and that will bring up the Data Profiling Task editor. On this General pane that is brought up, the first thing I will need to configure is where I want to save the XML output from my profiling task. I want the output to go to the “C:\temp\ColumnStatistics.xml” file. Screen Shot 2 shows what Data Profiler destination options I used to identify where the Data Profiling task is to save my Column Statistics profiling output.
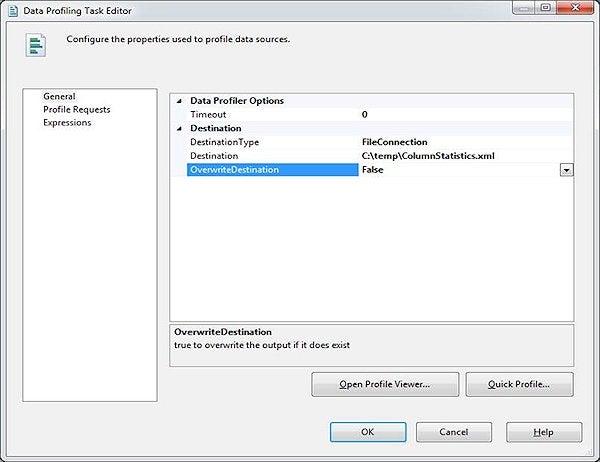
Screen Shot 2: Configuring Where to Create the XML Output for the Data Profiling Task
My next step is to set up my profile request. To set up the request I first need to bring up the Profile Request Pane. To do that I just click once on the “Profiler Request” item in the left pane. Doing this brings up the Profile Requests properties in the right pane. Since I have yet to define any profile request properties there are no profile request properties displayed in the right pane.
To add a new profile request I need to click once in the text box under the “Profile Request” item in the right pane. Upon doing this a little drop down arrow appears. I then need to click on the drop down arrow to display a list of available profiles. Once the list of profiles is displayed I hover my mouse over the “Column Statistics Profile Request” item and then click once. Next I need to click once in the text box under the “Request ID” heading. Upon doing this a Request ID value will be generated and the Request Properties for the Column Statistics will be displayed as shown in Screen Shot 3.
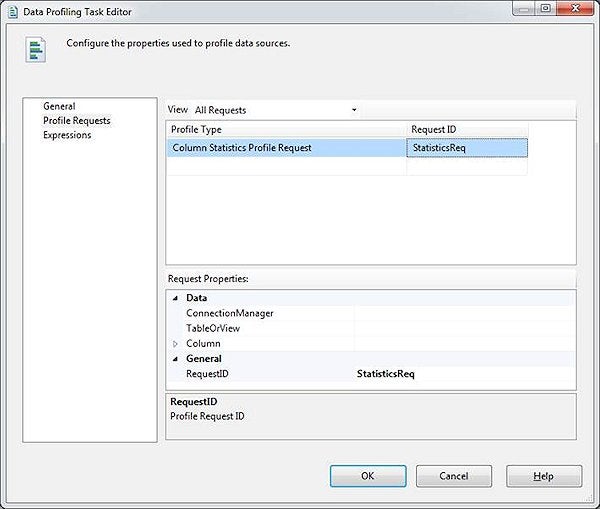
Screen Shot 3: Request Properties for Column Statistics Profile
By reviewing Screen Shot 3 you can see that the request properties have not been completely populated. I will need to identify the appropriate values in these properties in order to have the Column Statistics Profile produce statistics for my Sales.TransactionDate Column.
The first two properties I need to identify are ConnectionManager and TableOrView. To identify these properties I first click on the text box next to the ConnectionManager label. I then use the drop down menu to define a new ADO.NET connection that points to the instance and tempdb database where I created my Sales table. Once my connection has been defined, I can click on the textbox next to the “TableOrView” label and use the drop down menu to select my Sales table.
The next step is to identify the column or columns I want to profile. I only want to profile my TransactionDate column. To identify this column I click on the text box next to the “Column” label and then use the drop down menu to select my TransactionDate column. After I am done identifying the column that I want to profile, my Request Properties window looks like the image in Screen Shot 4.
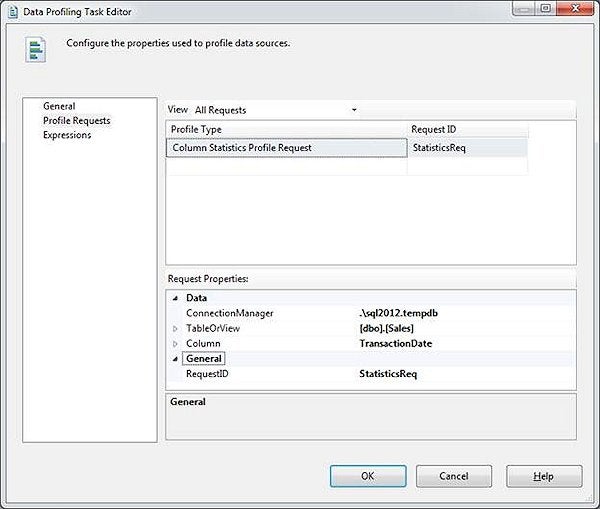
Screen Shot 4: Request Properties for Column Statistics Profile
All I need to do to complete the setup of my Column Statistics profile is to click on the “OK” button. Upon doing this I am taken back to the control flow screen of my Visual Studio project. At this point I’m ready to execute my profile request.
After executing my profile request I can review the XML output created. To do this I need to run the Data Profile viewer. There are a number of ways to bring up the viewer. I find the easiest way to view the profile information is to double click on the Data Profiling task in the control flow and then use the “Open Profile Viewer…” button. When I do this the window in Screen Shot 5 is displayed.
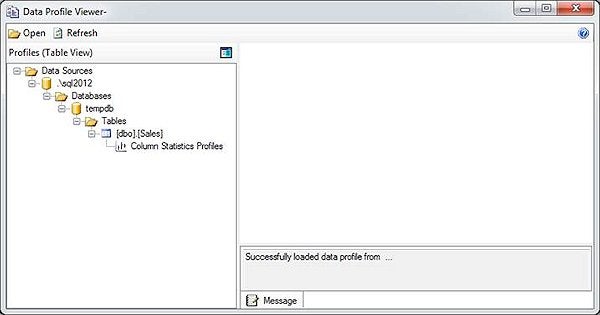
Screen Shot 5: Initial Data Profiler Viewer Window
If you look in the left pane in the Data Profiler Viewer window you will see a tree that shows the column statistics profiles for my dbo.Sales table. In order to view the column statistics I need to click on the “Column Statistics Profiles” item. Upon doing this Screen Shot 6 is displayed.
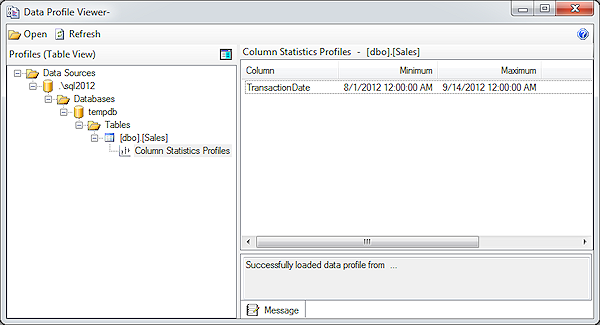
Screen Shot 6: Column Statistics
On Screen Shot 6 you will see that Minimum and Maximum values that the profiling tasked identified for the Transaction date. As you can see the data in my Sales table doesn’t meet my business rule of having transaction dates that only fall in the month of September 2012. It appears that the minimum value for a transaction date is 8/1/2012, which means at least one of my transaction records is not in the month of September.
The Column Statistics Profile is useful for finding the value ranges of integer and date columns. This can be useful to determine whether or not your data is within the range of value you expect.
Using the Functional Dependency Profile to Validate Your Data
If one or more columns in your incoming data have dependency relationships between them then you can use the Functional Dependency Profile to validate column dependencies. The Functional Dependency profile compares different columns in a single row to determine if there are data dependencies between different column values.
To demo the Functional Dependency Profile I first need to generate some data I can use to run through this profile. To generate my test data I will create an IncomingData table in tempdb. The IncomingData table will have two columns “StateName” and “StateCode”. I will be using the Functional Dependency profile to validate that each “StateName” value, has the same “StateCode” value associated with it. The code I used to populate my IncomingData table can be found in Listing 2.
SET   NOCOUNT ON;
USE   tempdb;
GO
--------------------------------------------------------------
--   Create Sample Staging File
--------------------------------------------------------------
CREATE   TABLE IncomingData (
      StateName varchar(60),
       StateCode   char(2)
       );

INSERT   INTO IncomingData VALUES ('Washington','WA');
INSERT   INTO IncomingData VALUES ('Washington','WA');
INSERT   INTO IncomingData VALUES ('Washington','WA');
INSERT   INTO IncomingData VALUES ('Washington','WS');
INSERT   INTO IncomingData VALUES ('Oregon','OR');
INSERT   INTO IncomingData VALUES ('Oregon','OR');
Listing 2: Creating IncomingCustomer records
To use the Functional Dependency profile I needed to first launch Visual Studio, and start building an SSIS package. Once my empty package is open I then drag the Data Profiling task to the Control Flow surface area. Once I have a Data Profiling task in my Control Flow pane I then double click on the Data Profiling task. This brings up the Data Profiling Task Editor, just like I did in the prior example.
To configure this profile I first start by identifying where to store the XML on the General pane of the Data Profiling Task Editor. For this example I store the XML file at C:\temp\FunctionalDependency.xml. Screen Shot 7 shows my General pane after I specified the XML destination.
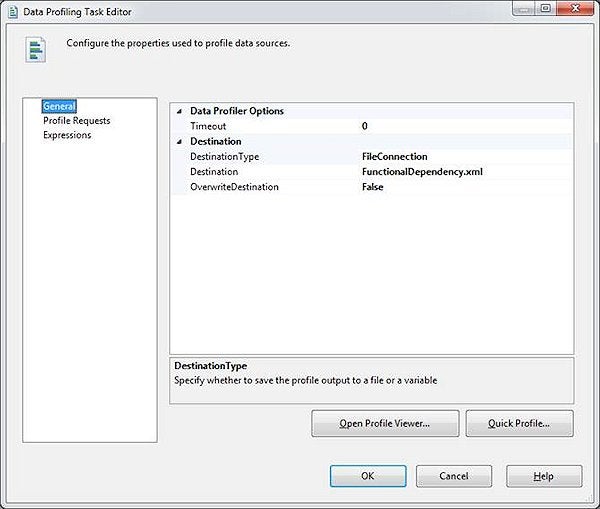
Screen Shot 7: General Pane for Functional Dependency Example
To define the columns I want to profile using the Functional Dependency profile, I need to use the Profile Request pane. On that pane I identify the Profile Type as Functional Dependency and then I will need to define my functional dependency properties.
To define my dependency properties I use the Request Properties pane of the Data Profiling Task Editor window. The first request property I need to define is the “Connection Manager” information. This property identifies the instance and database where my “IncomingData” resides, which in my case it is in a named instance called “SQL2012” and a database named “tempdb”. Next I need to define the “TableOrView” property. In this property I identify that I want to profile the “IncomingData” table that I created with Listing 2.
Next I need to identify the column dependencies. In my IncomingData table I want to make sure that the StateName column, maps consistently with the StateCode. Meaning I want the StateCode to be the appropriate abbreviation for the StateName. To define this dependency relationship I will define the StateName column as my DeterminantColumn and the StateCode will be my DependentColumn.
The last thing I need to define is the ThresholdSetting. There are three different possible options for the ThresholdSetting, Exact, None, and Specified. When you use the “Exact” ThresholdSetting, the Functional Dependency profile will only create output if it determines that the Functional Dependency strength is exactly the same as the “FDStrengthThreshold” setting. If you use the “None” ThresholdSetting, then the Functional Dependency profile will always output Functional Dependency Profile information regardless of what it calculates for the functional dependency strength. If you use the “Specified” ThresholdSetting, then the Functional Dependency profile will only output dependency information if the profile calculates that the functional dependency strength is greater than the “FDStrengthThreshold” specified. I’ve found it best to specify “None” for the Threshold setting when I’m designing my profiling task, and then once I know the average functional dependency strength calculated by the profile I can further refine my profile settings to use either the “Exact” or the “Specified” setting. For my example I will be using the “None” setting.
When I’m done configuring my functional dependency properties the Request Properties pane looks like Screen Shot 8.
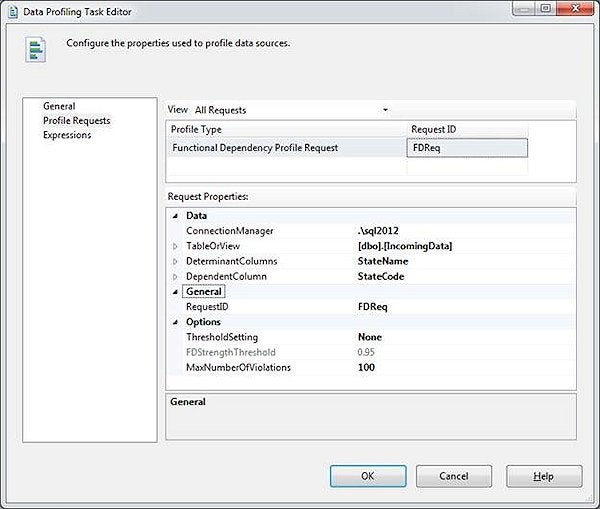
Screen Shot 8: Functional Dependency Request Properties
After I click on the “OK” button, I can then execute my Data Profiling Task. Once my profiling task completes I can use the Profile Viewer to determine if there are any StateName/StateCode dependency that violates the rule I defined. When I review the XML output created from my Data Profile task I get the Output in Screen Shot 9.
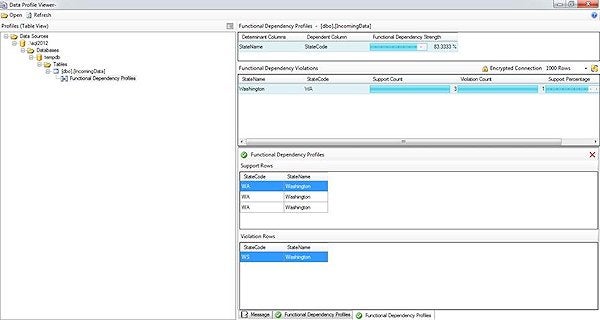
Screen Shot 9: Functional Dependency Profile Output
By reviewing the output in Screen Shot 9 you can see that there is one row in my IncomingData table that has an invalid state code value. In my example it was “WS”, which is not the correct abbreviation for Washington.
Verify Data is Contained in a Lookup Table Using the Value Inclusion Profile
When you are loading a table that has foreign key relationships with other tables, your INSERT statement will fail if your data row violates the foreign key constraint. To make sure your foreign key tables have all the values contained in your incoming data you can use the Value Inclusion profile. This profile will identify those column values that do not exist in your foreign key tables. Identifying those missing values will help you pre-populate those foreign key tables prior to loading your incoming data.
To demonstrate how the Inclusion Profile works let me show you an example. In my demo I will be showing you how to identify the ProductId’s that are contains in an IncomingSales table record that are not contained in my Product table. In order to demonstrate this I first need to create my sample Product and Sales tables. If you want to follow along you can use to code in Listing 3 to create these two demo tables.
USE   tempdb;
go
CREATE   TABLE Product (
     ProductID int,
     ProductName varchar(100),
     ProductPrice money
     )
INSERT   INTO Product values
        (1, 'Widget', 29.99),
        (2, 'WIdget 2', 39.99);
CREATE   TABLE IncomingSales (
     SalesID int,
     ProductID int,
     Qty int);
INSERT   INTO IncomingSales values
     (1, 1, 10),
     (2, 2, 5),
     (3, 3, 29);
Listing 3: Script to Create Tables for Value Inclusion Example
By reviewing Listing 3 you can see that my IncomingSales table contains three different records, where the third record has a ProductId value of 3. Since my Product table only contains two product records with ProductID values of 1 and 2 respectively, this means the ProductID value of 3 in my IncomingSales table is invalid. Let me show you how to define a Data Profile task that uses the Value Inclusive profile to identify the ProductId values in the IncomingSales table that are not valid values in the Product table.
Just like the rest of my examples the first thing I need to do is drag the Data Profiling task into the Control Flow of a SSIS package. Then I need to start setting the properties of this data profile task. The first property I need to set is the destination of where I want the Data Profiling tasks to write the XML output. In my case I want my output to go to the C:\temp\ValueInclusion.xml file.
Next I define my Profile Request properties. For this example I select the “Value Inclusive Profile Request” as the profile type I want to run. For the profile “ConnectionManager” property I point it to the instance and database where I created my tables using the code in the Listing 3, which in my case it is the tempdb database on my SQL2012 instance.
Next I need to define the “SubsetTableOrView” Property. This property is used to identify my “IncomingSales” table. I then set the “SupersetTableOrView” property to identify the lookup table I want to use to validate my ProductID’s from my “IncomingSales” table. In my example that would be the “Product” table in my tempdb database.
The last settings that need to be set are the threshold settings. The threshold settings for the Value Inclusion profile are used similarly to the Functional Dependency profile threshold settings I talked about in the prior section. Therefore to make sure I get results, I will use the value “None” for the “InclusiveThresholdSetting” and the “SupersetColumnsKeyThresholdSetting” profile settings. Screen Shot 10 shows the properties I selected for my Value Inclusion Profile request.
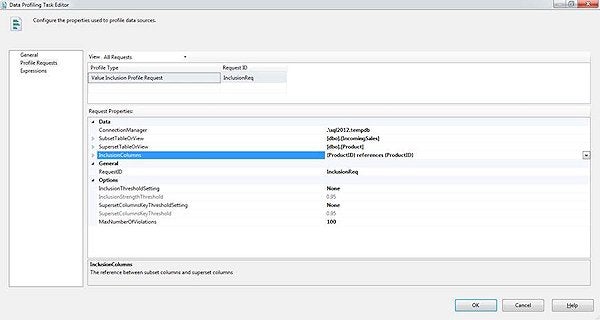
Screen Shot 10: Value Inclusive Profile Request Properties
By reviewing Screen Shot 10 you can see I chose to check and see if the ProductId value in IncomingData table is one of the ProductId’s in the superset table named Product. After saving these profile setting I execute my Data Profiling Task, and then review the results. You can see my results by reviewing Screen Shot 11:
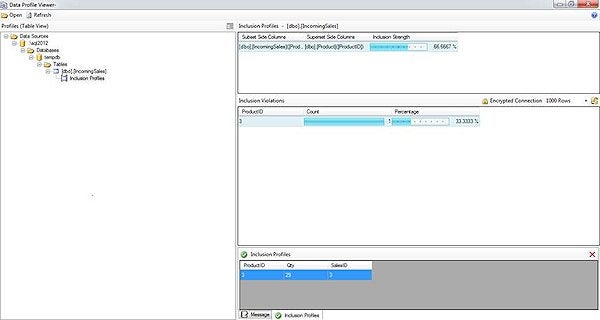
Screen Shot 11: Output of the Value Inclusive Profile
By reviewing Screen Shot 11 you can see that 1 record in the IncomingSales table doesn’t have a matching ProductID value in the Product table. By drilling down on the details of the Inclusion Violations you can see that ProductID value of 3 is not contained in the Product table.
Using Data Profiling Task to Determine the Quality of Your Incoming Data
Understanding the shape of the data you are trying to import is important. By using the different profiles you can determine how to clean up your incoming data prior to loading it into your database. If you run your incoming data through the Value Inclusion profile you can determine if additional values are needed in your lookup tables prior to loading your incoming data. Next time you are wondering how clean your incoming data might be, consider setting up and running a number of different profile requests to review your data prior to loading it into your production database environment.