


Inserting additional columns to a crosstab query is less straightforward than adding row data, because SQL naturally groups data by rows. Moreover, the efficacy of the CASE statement within an aggregate function decreases in direct proportion to the complexity of the criteria. Read on to learn more…
Today’s topic is crosstabs, which contain multiple aggregate functions in the column axis. This article is a continuation of Multi-Aggregated Rows in Crosstab Queries. As we will see, inserting additional columns to a crosstab query is less straightforward than adding row data, the reason being that SQL naturally groups data by rows. Moreover, we will see how the efficacy of the CASE statement within an aggregate function decreases in direct proportion to the complexity of the criteria.
As in the previous articles on the crosstab query, we’ll be limiting the scope to queries where the number of possible values in the column axis is known beforehand. Generating results based on a variable number of columns is also possible, but it requires writing a stored procedure. We’ll be getting to that once we’ve dealt with a few more scenarios relating to predefined columns.
Aggregating on Different Table Columns
In many instances, it is simple enough to add more fields to a crosstab query, by aggregating on different table columns. For example, a crosstab that shows the SUM of lawnmowers and garden hose sales for a collection of retail stores could be easily produced in this way, since the sales of each product would presumably be stored in different columns. Applying the same idea to our TA_CASES table, we could add a COUNT of supplied CITIZENSHIPS, because it has its own column, unrelated to the FEE_NUMBERs. We can obtain a count of the citizenships entered by counting the CITIZENSHIP_CODE field because the COUNT function ignores NULL values. The FEE_NUMBER counts, on the other hand, will always show the total number of cases for the region because it is the primary key and thus, cannot contain NULL values or duplicates. Here is the code for the inner SQL statement that would procure both counts:
SELECT YEAR(CREATION_DATE) AS Year,
MONTH(CREATION_DATE) AS Month_Num,
MONTHNAME(CREATION_DATE) AS Month,
COUNT(CASE WHEN REGION_CODE ='01' THEN FEE_NUMBER END) AS REGION_1_CASES,
COUNT(CASE WHEN REGION_CODE ='01' THEN CITIZENSHIP_CODE END) AS REG_1_CIT_COUNT,
COUNT(CASE WHEN REGION_CODE ='02' THEN FEE_NUMBER END) AS REGION_2_CASES,
COUNT(CASE WHEN REGION_CODE ='02' THEN CITIZENSHIP_CODE END) AS REG_2_CIT_COUNT,
COUNT(CASE WHEN REGION_CODE ='03' THEN FEE_NUMBER END) AS REGION_3_CASES,
COUNT(CASE WHEN REGION_CODE ='03' THEN CITIZENSHIP_CODE END) AS REG_3_CIT_COUNT,
COUNT(CASE WHEN REGION_CODE ='04' THEN FEE_NUMBER END) AS REGION_4_CASES,
COUNT(CASE WHEN REGION_CODE ='04' THEN CITIZENSHIP_CODE END) AS REG_4_CIT_COUNT,
COUNT(CASE WHEN REGION_CODE ='05' THEN FEE_NUMBER END) AS REGION_5_CASES,
COUNT(CASE WHEN REGION_CODE ='05' THEN CITIZENSHIP_CODE END) AS REG_5_CIT_COUNT,
COUNT(FEE_NUMBER) AS 'TOTAL CASES',
COUNT(CITIZENSHIP_CODE) AS TOTAL_CIT_COUNT
FROM TA_CASES
WHERE CREATION_DATE IS NOT NULL
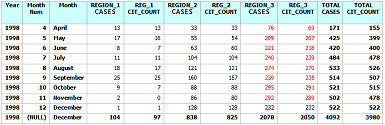
GROUP BY Year, Month_Num WITH ROLLUP;
If you look closely at the resulting table below, you’ll notice that the citizenship counts are sometimes less than those for the region. For example, all but the last row of the citizenship counts for Region 3 are less than those of the Region (shown in RED). Those missing citizenships are the NULL values. (Note that the results were limited to 1998 and the REGION 4 and 5 data was omitted in order to fit the table on the page):
Filtering Column Data on Simple Criteria
Obtaining counts for a specific Citizenship proves to be only slightly more complex than the previous example. To do that, we need to add the CITIZENSHIP_CODE to the citizenship count field’s CASE statement for comparison:
COUNT(CASE WHEN REGION_CODE ='01' THEN FEE_NUMBER END)        AS REGION_1,
COUNT(CASE WHEN REGION_CODE ='01'
           AND  CITIZENSHIP_CODE = '205' THEN FEE_NUMBER END) AS Cit_1,
Applying the above code to the original query yields the following, somewhat longer, SELECT statement:
SELECT CASE WHEN Year IS NULL
            THEN 'GRAND TOTAL'
            ELSE Year
       END       AS 'Year',
       CASE WHEN Month_Num IS NULL
            THEN CASE WHEN Year IS NULL
                      THEN ''
                      ELSE CONCAT(Year, ' TOTAL')
                 END
            ELSE Month
       END      	AS 'Month',
       Cit_1	 	AS 'Indian Cit for Region 1',
       REGION_1 	AS 'REGION 1',
       Cit_2	 	AS 'Indian Cit for Region 2',
       REGION_2 	AS 'REGION 2',
       Cit_3	 	AS 'Indian Cit for Region 3',
       REGION_3 	AS 'REGION 3',
       Cit_4	 	AS 'Indian Cit for Region 4',
       REGION_4 	AS 'REGION 4',
       Cit_5	 	AS 'Indian Cit for Region 5',
       REGION_5 	AS 'REGION 5',
       Cit_TOTAL 	AS 'Indian Cit Total',
       REGION_TOTAL AS 'REGION TOTAL'
FROM  (SELECT YEAR(CREATION_DATE)                                           AS Year,
              MONTH(CREATION_DATE)                                          AS Month_Num,
              MONTHNAME(CREATION_DATE)                                      AS Month,
              COUNT(CASE WHEN REGION_CODE ='01' THEN FEE_NUMBER END)        AS REGION_1,
              COUNT(CASE WHEN REGION_CODE ='01'
                         AND  CITIZENSHIP_CODE = '205' THEN FEE_NUMBER END) AS Cit_1,
              COUNT(CASE WHEN REGION_CODE ='02' THEN FEE_NUMBER END)        AS REGION_2,
              COUNT(CASE WHEN REGION_CODE ='02'
                         AND  CITIZENSHIP_CODE = '205' THEN FEE_NUMBER END) AS Cit_2,
              COUNT(CASE WHEN REGION_CODE ='03' THEN FEE_NUMBER END)        AS REGION_3,
              COUNT(CASE WHEN REGION_CODE ='03'
                         AND  CITIZENSHIP_CODE = '205' THEN FEE_NUMBER END) AS Cit_3,
              COUNT(CASE WHEN REGION_CODE ='04' THEN FEE_NUMBER END)        AS REGION_4,
              COUNT(CASE WHEN REGION_CODE ='04'
                         AND  CITIZENSHIP_CODE = '205' THEN FEE_NUMBER END) AS Cit_4,
              COUNT(CASE WHEN REGION_CODE ='05' THEN FEE_NUMBER END)        AS REGION_5,
              COUNT(CASE WHEN REGION_CODE ='05'
                         AND  CITIZENSHIP_CODE = '205' THEN FEE_NUMBER END) AS Cit_5,
              COUNT(CASE WHEN CITIZENSHIP_CODE = '205' THEN FEE_NUMBER END) AS Cit_TOTAL,
              COUNT(FEE_NUMBER)                                             AS REGION_TOTAL
       FROM   TA_CASES
       WHERE  CREATION_DATE IS NOT NULL
       GROUP BY Month_Num WITH ROLLUP) AS CA;
Our query now produces a count of Indian citizenships as well as total cases for each region. As would be expected, the counts of Indian citizenships are far lower than those of cases. (Again, the results were limited to 1998 and the REGION 4 and 5 data were omitted in order to fit the table on the page):
|
Year |
Month |
Indian Cit for Region 1 |
REGION 1 |
Indian Cit for Region 2 |
REGION 2 |
Indian Cit for Region 3 |
REGION 3 |
Indian Cit Total |
REGION TOTAL |
|
1998 |
April |
0 |
13 |
1 |
33 |
1 |
76 |
2 |
171 |
|
1998 |
May |
0 |
17 |
2 |
55 |
9 |
209 |
11 |
425 |
|
1998 |
June |
0 |
8 |
0 |
63 |
7 |
221 |
10 |
420 |
|
1998 |
July |
0 |
11 |
2 |
104 |
12 |
240 |
17 |
484 |
|
1998 |
August |
0 |
18 |
0 |
121 |
4 |
274 |
7 |
533 |
|
1998 |
September |
0 |
25 |
1 |
160 |
1 |
239 |
7 |
514 |
|
1998 |
October |
0 |
9 |
0 |
88 |
6 |
295 |
10 |
521 |
|
1998 |
November |
0 |
2 |
0 |
86 |
3 |
292 |
3 |
502 |
|
1998 |
December |
0 |
1 |
2 |
128 |
3 |
232 |
5 |
522 |
|
1998 |
1998 TOTAL |
0 |
104 |
8 |
838 |
46 |
2078 |
72 |
4092 |
If you look closely at the above SQL code, you will notice that the new CASE statement is adding a lot of repetition to the query because the same citizenship (code 205) is being checked for each citizenship count. This condition becomes ever more burdensome as we include more filtering. The next installment will introduce a new way to perform crosstab queries that will help minimize redundant code in the field selection.