


Hi, today’s recipe will be to simply place a chart on a form, that is
linked
to data on the SQL Server. Done in a flash!
What you’ll need for this recipe:
1
Visual Basic 6 Application
1
SQL 7 Server
1
pound of glee and enthusiasm!
Update! ->
Download
Video of this article! First Download CODEC(128KB)
to be able to see it and Install, Then Download Video
(825 KB) (if it’s really slow… stop video, and save to your hard drive,
then
run it again.)
The
video
assumes you have the data table below already in SQL Server, and that the
code
for your form has already been inserted into the code view of your
form.
Great,
now let’s start:
First
make sure you have a table, or view in your SQL 7 Server that you want to
chart.
For those of us that have no data available, open the ‘Query Analyzer’ and
copy-paste & execute the following:
—Start
SQL commands—
use
pubs
if exists (select * from sysobjects where id =
object_id(N’[dbo].[DataTable]’) and OBJECTPROPERTY(id, N’IsUserTable’) =
1)
drop table [dbo].[DataTable]
GO
CREATE TABLE [dbo].[DataTable] (
[Data_Date] [datetime] NOT NULL ,
[Data_Value] [int] NOT NULL ,
[Data_Name] [char] (20) NOT NULL
) ON [PRIMARY]
GO
INSERT [dbo].[DataTable] VALUES (’01/01/1999′, 10, ‘SuperGuyToy’)
INSERT [dbo].[DataTable] VALUES (’02/01/1999′, 15, ‘SuperGuyToy’)
INSERT [dbo].[DataTable] VALUES (’03/01/1999′, 20, ‘SuperGuyToy’)
INSERT [dbo].[DataTable] VALUES (’04/01/1999′, 13, ‘SuperGuyToy’)
INSERT [dbo].[DataTable] VALUES (’05/01/1999′, 7, ‘SuperGuyToy’)
INSERT [dbo].[DataTable] VALUES (’06/01/1999′, 18, ‘SuperGuyToy’)
INSERT [dbo].[DataTable] VALUES
(’07/01/1999′, 19, ‘SuperGuyToy’)
INSERT [dbo].[DataTable] VALUES (’08/01/1999′, 24, ‘SuperGuyToy’)
INSERT [dbo].[DataTable] VALUES (’09/01/1999′, 26, ‘SuperGuyToy’)
INSERT [dbo].[DataTable] VALUES (’10/01/1999′, 32, ‘SuperGuyToy’)
INSERT [dbo].[DataTable] VALUES (’11/01/1999′, 38, ‘SuperGuyToy’)
INSERT [dbo].[DataTable] VALUES (’12/01/1999′, 42, ‘SuperGuyToy’)
—End
SQL commands—
Ok,
now that we all have some data in SQL 7, we can open Visual Basic 6 and
start
playing around!
Visual
Basic 6:
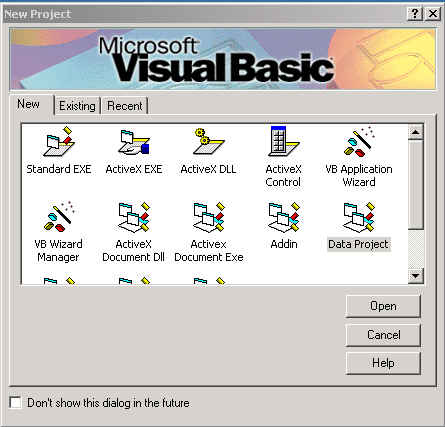
When
you open visual basic, you’ll have lot’s of projects to choose from like in
the
picture below:
Don’t
worry if you don’t have all of these, all you really need to open is the
"Standard EXE" Project.
-
Open
the Standard EXE Project
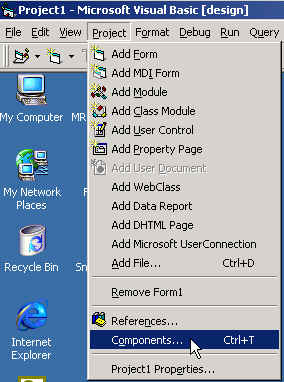
Ok,
now from the main toolbar select project, and then under it select
components…
Next
you’ll see a big list of components that you can check mark. Find the
following
component and check it off here…
-
Microsoft
Chart Control 6.0
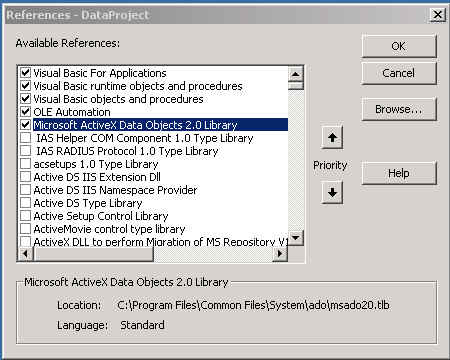
Also
remember to have the following references selected:
Ok,
now were have selected all the items that we need, now lets place our chart
on
the form… and a command button named. Name the button
"cmdClose".
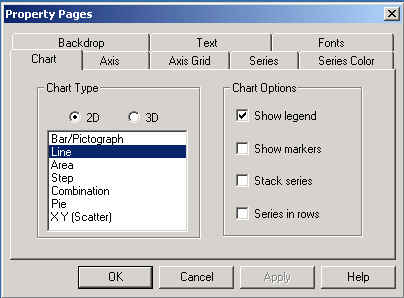
Next
select the charts properties by right clicking on the chart, and making your
choices. If this is your first time just select the 2d line chart as below,
showing the legend…
Ok
finished with that…now the precious code…
The
Code:
Most
of the code that you will use will probably look the same for all of these
SQL
linked charts, all Except what is highlighted below. The highlighted items
can
be changed depending on your table data, your server, UID, password, etc…
but
most of the other data will always tend to be the same for simple SQL driven
Charts. To use the code just drop it in the declarations section (code view)
of
your form.
The
shape command is a necessary evil for charts… so if you want to be an
expert,
read up on it. Otherwise… see the notes below so you can at least LOOK
like an
expert. 🙂
—–Begin
Code—-
Private Const MARGIN_SIZE = 60
Private Const SHAPE_COMMAND =
“SHAPE {select Data_Date,Data_Value,Data_Name from DataTable Order by
Data_Date} AS ChildCommand COMPUTE ChildCommand,
AVG(ChildCommand.[Data_Value]) AS [Data_Value] BY [Data_Date],
[Data_Name]”
Private CONNECT_STRING As String
Private Const FIELD_X =
“Data_Date”
Private Const FIELD_Y =
“Data_Value”
Private Const FIELD_Z =
“Data_Name”
Private Const VBERR_INVALID_PROCEDURE_CALL = 5
Private Const MARKERS_VISIBLE = 0
Private Const BRACKET_LEFT = “[”
Private Const BRACKET_RIGHT = “]”
Private Const SPACE_CHAR = ” “
Private Sub cmdClose_Click()
Unload Me
End Sub
Private Sub DisplayError(oError As ErrObject)
MsgBox oError.Description, vbExclamation, App.Title
End Sub
Private Sub Form_Load()
Dim conShape As ADODB.Connection
Dim recShape As ADODB.Recordset
CONNECT_STRING =
“Provider=MSDataShape;data provider=MSDASQL;Driver={SQL
Server};Server=a-anthlo2;Database=pubs;UID=sa;PWD=;"
On Error GoTo Form_Load_Error
‘Create and open connection to the Data Shape provider
Set conShape = New ADODB.Connection
conShape.Open CONNECT_STRING
‘Create and open a recordset
Set recShape = New ADODB.Recordset
recShape.Open SHAPE_COMMAND, conShape
‘Fill the chart with the recordset data
ShowRecordsInChart recShape, FIELD_X, FIELD_Y, FIELD_Z
‘Show or hide markers
ShowMarkers MARKERS_VISIBLE
Exit Sub
Form_Load_Error:
DisplayError Err
Exit Sub
End Sub
Private Sub Form_Resize()
Dim sngButtonTop As Single
Dim sngScaleWidth As Single
Dim sngScaleHeight As Single
On Error GoTo Form_Resize_Error
With Me
sngScaleWidth = .ScaleWidth
sngScaleHeight = .ScaleHeight
‘Move Close button to the lower right corner
With .cmdClose
sngButtonTop = sngScaleHeight – (.Height + MARGIN_SIZE)
.Move sngScaleWidth – (.Width + MARGIN_SIZE), sngButtonTop
End With
.MSChart1.Move MARGIN_SIZE, _
MARGIN_SIZE, _
sngScaleWidth – (2 * MARGIN_SIZE), _
sngButtonTop – (2 * MARGIN_SIZE)
End With
Exit Sub
Form_Resize_Error:
‘An error will occur if the user sizes
‘the form so small that negative heights
‘or widths are calculated
Resume Next
End Sub
Private Function IsKeyInCollection(cCol As Collection, sKey As String) As
Boolean
Dim v As Variant
On Error Resume Next
v = cCol.Item(sKey)
‘It is important to check for error 5, rather than checking for
‘any error, because an error could occur even if the key is valid.
‘If the key existed, but it was associated with an element that
‘was an object, an error would occur because ‘Set’ wasn’t used
‘to assign it to ‘v’.
IsKeyInCollection = (Err.Number <> VBERR_INVALID_PROCEDURE_CALL)
Err.Clear
End Function
Private Sub ShowMarkers(bShow As Boolean)
Dim i As Long
On Error GoTo ShowMarkers_Click_Error
With MSChart1.Plot
For i = 1 To .SeriesCollection.Count
.SeriesCollection(i).SeriesMarker.Show = bShow
Next
End With
Exit Sub
ShowMarkers_Click_Error:
DisplayError Err
Exit Sub
End Sub
Private Sub ShowRecordsInChart(recParent As Recordset, _
sFldX As String, _
sFldY As String, _
sFldZ As String)
Dim bUseZ As Boolean
Dim cRows As Collection
Dim cCols As Collection
Dim lCol As Long
Dim lRow As Long
Dim lMaxCol As Long
Dim lMaxRow As Long
Dim sValue As String
On Error GoTo ShowRecordsInChart_Error
If Len(sFldZ) = 0 Then bUseZ = False Else bUseZ = True
Set cRows = New Collection
Set cCols = New Collection
With Me.MSChart1
‘Turn off chart painting
.Repaint = False
With .DataGrid
‘Clear the chart
.DeleteRows 1, .RowCount
.DeleteColumns 1, .ColumnCount
.DeleteColumnLabels 1, .ColumnLabelCount
.DeleteRowLabels 1, .RowLabelCount
‘Make sure there is one level of labels
.InsertColumnLabels 1, 1
.InsertRowLabels 1, 1
‘If the Z axis is not being used, make
‘sure there is one column
If Not bUseZ Then .InsertColumns 1, 1
recParent.MoveFirst
Do Until recParent.EOF
‘Make sure a row is added for this X field
sValue = FixNull(recParent.Fields(sFldX).Value, False)
If Not IsKeyInCollection(cRows, sValue) Then
lMaxRow = lMaxRow + 1
lRow = lMaxRow
‘Store the row index associated with
‘the Row name
cRows.Add lRow, sValue
.InsertRows lRow, 1
.RowLabel(lRow, 1) = sValue
Else
lRow = cRows.Item(sValue)
End If
‘Make sure a column is added for this Z field
If bUseZ Then
sValue = FixNull(recParent.Fields(sFldZ).Value,
False)
If Not IsKeyInCollection(cCols, sValue) Then
lMaxCol = lMaxCol + 1
lCol = lMaxCol
‘Store the column index associated with
‘the column name
cCols.Add lCol, sValue
.InsertColumns lCol, 1
.ColumnLabel(lCol, 1) = sValue
Else
lCol = cCols.Item(sValue)
End If
‘Set the datapoint value for this record’s row and
column
.SetData lRow, lCol,
FixNull(recParent.Fields.Item(sFldY).Value, True), 0
Else
‘Set the datapoint value for this record’s row
‘There is only one column in this case
.SetData lRow, 1,
FixNull(recParent.Fields.Item(sFldY).Value, True), 0
End If
‘Move the recordset to the next record
recParent.MoveNext
Loop
End With
‘Turn painting back on
.Repaint = True
End With
Exit Sub
ShowRecordsInChart_Error:
‘Make sure the charts painting is turned back on
Me.MSChart1.Repaint = True
DisplayError Err
Exit Sub
End Sub
Private Function FixNull(vField As Variant, _
bNumericRequired As Boolean) As Variant
If IsNull(vField) Then
If bNumericRequired Then
FixNull = 0
Else
FixNull = vbNullString
End If
Else
FixNull = vField
End If
End Function
—–End
Code—-
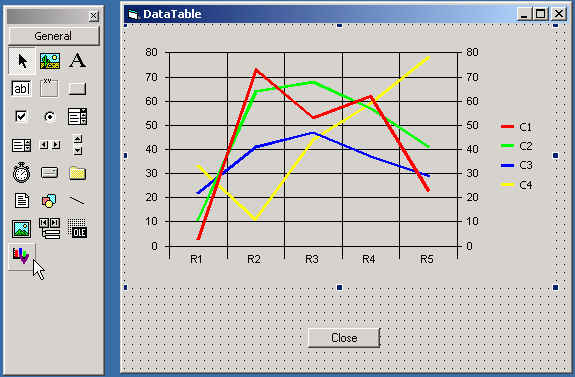
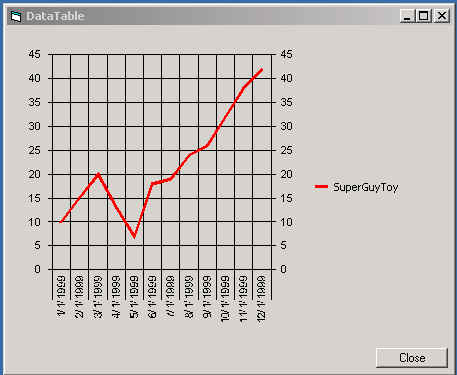
Finished
Chart should look like this when you run your project:
Looking
like an Expert:
Much
of this code was originally done in the "Data Form Wizard" with an
Access backend, but the connect string was modified to connect to the SQL 7
server called "a-anthlo2" with the "Pubs"
Database,
and the table called "DataTable".
If
you have trouble creating your particular chart, transfer part of the data
to a
local Access Database, Then use the Chart wizard on it. After you feel great
with you results… change the connection string so that your chart looks
toward
the SQL Server! Then you’ll be done!
Happy
charting!
Oh
by the way, the Data form wizard" can be loaded using the Add-In
Manager in
the toolbar under "Add-Ins".
About
Me:
Anthony
Loera has been goofing around VB for more than 5 years. Has coded for
Bell
Atlantic, & Americatel Telecom companies. Currently contracted on a
couple
projects for a small unknown company called Microsoft, and doing a side
project
for another small pharmaceutical company, which would kill him if it’s name
was
ever divulged. 😉