In SQL Server 2000, the SQL Profiler can help you diagnose and fix SQL Server
performance issues. This tool lets you trace events and play back the results,
which can help you determine application and/or query problems, such as
long-running queries or ineffective indexes. Let’s take a look at how you can
use the SQL Profiler to monitor, analyze, and tune your SQL server.
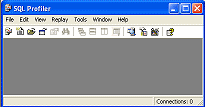
When you open SQL Profiler (Figure A), you can run traces on a set of
criteria you specify.
Click for larger image
Figure A.
These criteria or events can be one or more of the following:
- Cursors
- Database
- Errors and Warnings
- Locks
- Objects
- Performance
- Scans
- Security Audit
- Server
- Stored Procedures
- Transactions
- TSQL
SQL Profiler includes a set of templates you can begin using right away. After
becoming fluent at working with SQL Profiler, you can create your own templates
or modify existing ones. Profiler offers the following eight templates shown in
Table A.
|
Table A |
||
|
Template name |
Template filename |
Definition |
|
Stored Procedure Counts |
SQLServerProfilerSP_Counts |
This template provides a collection of events about the |
|
Standard |
SQLServerProfilerStandard.tdf |
This template provides detailed information about Security |
|
TSQL |
SQLServerProfilerTSQL |
This template traps TSQL Statements in the order that they |
|
TSQL Duration |
SQLServerProfilerTSQL_Duration |
This template traps the TSQL Statements, Event Class, SPID, |
|
TSQL Grouped |
SQLServerProfilerTSQL_Grouped |
This template groups your TSQL Statements by Application |
|
TSQL Replay |
SQLServerProfilerTSQL_Replay |
This template traps detailed information of the TSQL |
|
TSQL Stored Procedures |
SQLServerProfilerTSQL_SPs |
This template traps the Stored Procedures and TSQL |
|
Tuning |
SQLServerProfilerTuning |
This template traps TSQL Statements and SQL Batches that |


