


Introduction
As a Production or Development DBA, we’d better know all the syntax of the command line interface (CLI) utilities whether it is sqlplus or old srvrmgr, which Oracle no longer supports. Moreover, command line interfaces are easy and certain. Oracle has command line interface tools for all of it components, such as ASMCMD for Automatic Storage Management (ASM). It is good to have a knowledge of some of the most frequently used commands for these interfaces, to troubleshoot any production issues when you do not have the luxury of extra time to look at the manuals or online knowledge base. For example, when you have to recover the production database, you will not have time to look at manuals for database recovery commands. That being said, it is not necessary to be familiar with all of the command line interface utilities that we use for ongoing issues. Let us say, I see unusual activity on my production database and ask the application community if there were any changes on their side, they reply that they are not sure exactly what is going on. Instead, they ask that I let them know what statements were executed in the database for the period in question to investigate. In situations like this, or for that matter anything that users request on production databases that are prone to human errors, are situations where GUI tools are vital since they lessen the possibility of human mistakes. Tools like TOAD are most user friendly and have less overhead. I would like introduce in this article, some of my favorite, more commonly used interfaces of TOAD 9.0.
Database activity
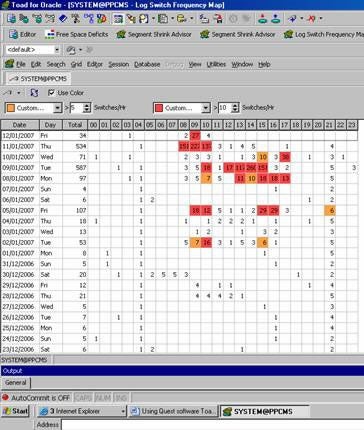
If there are numerous changes to the database, we see the number of archive log files generated grow, or as some call it as “excessive redo generation”. If a DBA did not notice how many archive logs were being generated for each hour, the database might end up with performance problems. Too many checkpoints put a high load on the buffer cache and IO sub system. Conversely, if you have three default redo log files created on the database, the archives can’t keep up and the database has to wait for the archver daemon process to catch up. In either case, it is important for the DBA to keep an eye on the number of redologs generated or how frequently log switches occur on the database. This can be done very easily by using TOAD.
There is also logmining interface, which can be important from time to time, especially to see user statements. This can be accessed by going to database->diagnose->logminer, which takes you to several other interactive screen where you specifiy the logfiles that you would like to mine. Database->Diagnose->logswitch Frequency Map takes you to the following screen.
Undo Advisor
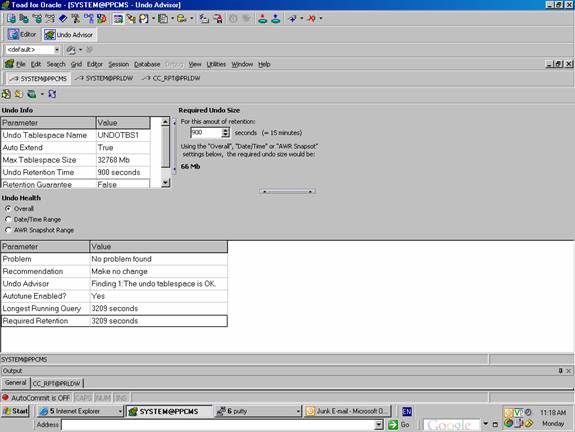
Starting with Oracle 9i, Oracle rollback segments were automated. How much undo retention must be retained in the database must be specified by the DBA. The default value of 900 seconds, on many of my databases, returns ORA-01555 – the very familiar “snap shot too old “error. Calculating the exact optimal undo retention value requires constant monitoring of database activity (undo blocks/second) and value of undo size. Estimating these two values requires querying from the data dictionary at different times in the database and there by changing the undo retention value to optimal value. This task is made simple using TOAD 9.0
Database->diagnose->undoadvisor takes you to the following screen.
Database Health check
It is some times necessary to check all performance statistics, for example, when users complain that the database is not running up to the mark. Then, your immediate task would be to look at the alert log and look in udump/bdump for any trace files. If you do not find anything unusual, you might get some clues if you run some health checks on your database to see if anything is hindering the performance, such as too many disk reads or insufficient memory, resulting in lower cache hit ratios.
Just login to TOAD and choose menu option database-> diagonsie->healthcheck, which would take you to the following screen. In this screen, you can deselect the options on which you don’t want the health check to be run. By default, some of the options that are essential to check the database health are already selected. By choosing the “Other Setting” tab, you can configure this report to send email to your dba group or to your self. The Report Output tab shows the results of the run.
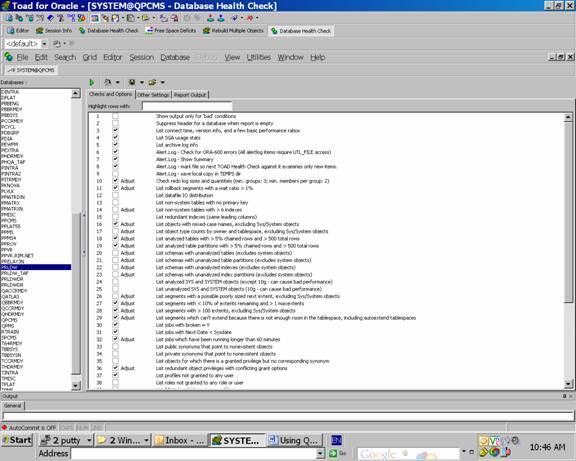
An example of the Output results is displayed below.
BEGIN OF THE REPORT:
*******************************************************************
*** MYDB                                22/01/2007 10:49:25 AM  ***
********************************************************************
~Time to Connect             : 12 seconds.
~Database Version            :  10.1.0.5.0
~Database Up Since           : 02:37:05 PM, January 15 2007
~!Buffer Cache Hit Ratio      : 73.6761
~Library Cache Miss Ratio    : 0.0176
~Dictionary Cache Miss Ratio : 0.0361
[Shared Pool Usage] Exec Time 0 seconds
~ Total Mb Unused : 14.99
~ Total Mb Used   : 177.01
~ Total Mb        : 192
~ Shared Pool Percent Used : 92.19
[Archive Log Mode Info] Exec Time 0 seconds
~ Archiver : STARTED
~ Log Mode : ARCHIVELOG
~ log_archive_start (init.ora param) = TRUE
[Archive Log Info] Exec Time 1 seconds
~ Average Log Switches Per Day                          : 212.58
~ Hard Drive Storage (in Mb) for this many archive logs : 42515.11
!  Error using UTL_FILE to examine alert log!
!  Error using UTL_FILE
!  Possible causes:
!  1)  You don’t have privileges to execute the UTL_FILE package.
!      To verify, try excuting this pl/sql block in Editor.
!      If you don’t have the required privileges, it will give an error.
declare
  afile utl_file.file_type;
begin
  if  utl_file.is_open(afile) then
    null;
  end if;
end;
!  2)  UTL_FILE_DIR initialization parameter does not include one of these lines:
!      utl_file_dir=/db/d01/oracle/admin/MYDB/bdump
!      utl_file_dir=*
!      To verify, look under DBA -> Oracle Parameters
!  3)  alert.log file name is not among the following:
!      (if this is the case please inform Quest support)
!      alert_MYDB.log
!      MYDBalrt.log
!  4)  No directory exists in the database for the OS path: /db/d01/oracle/admin/MYDB/bdump,
!      or directory exists but privileges have not been granted for it.
!      Execute these SQL Statements to remedy:
CREATE OR REPLACE DIRECTORY TOAD_BDUMP_DIR as ‘/db/d01/oracle/admin/MYDB/bdump’;
GRANT READ, WRITE on DIRECTORY TOAD_BDUMP_DIR to <oracle user executing health check>;
[Redo Log Group Sizes and Quantities] Exec Time 0 seconds
~ Number of Log Groups : 6
~ Number of Members per Log Group: 2
~ All redo log members are 200M in size.
[Rollback Segments with wait ratios > 1 %] Exec Time 1 seconds
~ None
[Objects with Mixed-Case Names] Exec Time 8 seconds
! Column             BBLG.SELF_PROV_USER_INFO.Company Size
! Synonym            PUBLIC./1025308f_SunTileScheduler
! Synonym            PUBLIC./10b943ec_CompoundPredicate
! Synonym            PUBLIC./1106a6c1_MultiplyOpImage
! Synonym            PUBLIC./110fa163_ClassificationTestRe
! Synonym            PUBLIC./116f06e2_HistogramOpImage
! Synonym            PUBLIC./1186c016_SampleModelProxy
! Synonym            PUBLIC./11f08aab_BandSelectCRIF
! Synonym            PUBLIC./1210b9d4_ParserAnnSaveExcepti
! Synonym            PUBLIC./125312dd_JPEGCodec
! Synonym            PUBLIC./1281e4ac_BorderExtenderReflec
! Synonym            PUBLIC./12be19b8_MedianFilt
[Objects which can’t extend because there is not
enough room in the tablespace] Exec Time 42 seconds
~ None
[Jobs] Exec Time 0 seconds
~ None
[redundant object privs with conflicting grant option] Exec Time 5 seconds
~ None
[Profiles that are not granted to any user] Exec Time 0 seconds
~ None
[FK’s w/o Matching Indexes (or an unusable one)] Exec Time 2 seconds
! Foreign Key: IC_ADMIN.FK_CATEGORY_TOPLEVELPARENTID
!   On Table:  CATEGORY
!   Columns:   TOPLEVELPARENTID
! Foreign Key: IC_ADMIN.FK_OBJECT_PARENTID
!   On Table:  OBJECT
!   Columns:   PARENTID
! Foreign Key: IC_ADMIN.FK_QNAIREFORM_TARGETINDIVID
!   On Table:  QUESTIONNAIREFORM
!   Columns:   TARGETINDIVID
! Foreign Key: IC_ADMIN.FK_RECORDEDRULE_INTXSEGMENTID
!   On Table:  RECORDEDRULE
!   Columns:   INTXSEGMENTID
! Foreign Key: IC_ADMIN.FK_TEMPLATEPARAM_PARENTID
!   On Table:  TEMPLATEPARAM
!   Columns:   PARENT_ID
[Tablespace Fragmentation] Exec Time 41 seconds
~ None
[Tablespaces with less than 10% free space] Exec Time 55 seconds
! CIC_ _I_REPORTING : 0.3% Free Space,  MB Free / Total : 39 / 15658
! CIC_ _REPORTING_IDX : 0% Free Space,  MB Free / Total : 6 / 17200
! CIC_ TRACING   : 6.3% Free Space,  MB Free / Total : 1247 / 19750
! CIC_ TRACING_IDX : 1% Free Space,  MB Free / Total : 300 / 28650
! I3_REPORTING              : 1.5% Free Space,  MB Free / Total : 219 / 14998
! I3_REPORTING_IDX          : 1% Free Space,  MB Free / Total : 122 / 12691
! TRACING_TBS            : 0.9% Free Space,  MB Free / Total : 322 / 37800
! USERS                     : 0.5% Free Space,  MB Free / Total : 1 / 203
END OF the REPORT
In the above report, notice some of statistics that are very critical to the database performance. The lines in red, in the code above, show that those items need to be addressed. The Buffer cache hit ratio is very low and some of the foreign keys do not have matching indexes or usable indexes on them. The total diagnostic process for a normal database runs in just a couple of minutes but a large data warehouse took more than a couple of hours to generate this report.
Server statistics: We can derive numerous statistics in minutes that would take several hours of DBA time to calculate, if we choose database => monitor => server statistics that takes you to a DBA server statistics screen, which looks like the image below.
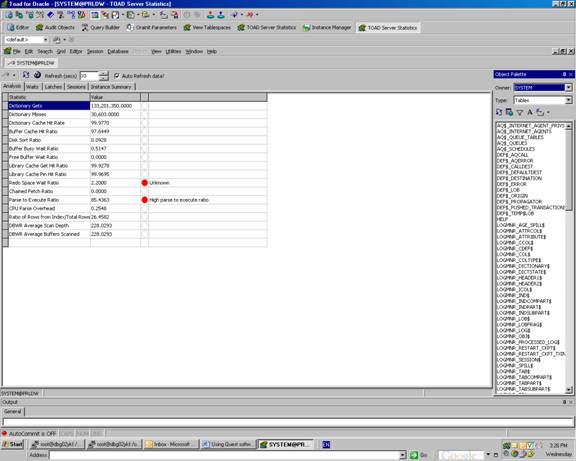
You can see all of the waits in the databases at a glance by choosing waits tab. Server statistics, such as dictionary cache hit ratio, buffer busy wait ratio, redo space wait ratio or any parse to execute ratio can be viewed by choosing the Analysis tab. These ratios give a clear picture of memory and cpu load, which the DBA needs to monitor from time to time. Many OLTP databases that have intensive transactions, but are relatively small in size, experience many latch waits. This happens because there are a few small tables that are intensively used by several sessions and are so called hot tables. It is important to monitor Latch waits and adjust the number of buffers and the number of latches based upon the type of the latches database is waiting for most. The Sessions tab, which I think is most useful for monitoring all active and non-active sessions in the database is very important.
In conclusion
There is always an interesting debate going on between DBAs about whether Graphical User interface or Command Line Interface is best to use to administer databases. The two modes for DBAs to interact with databases are important. Using a GUI is faster; picking and choosing icons sure beats trying to remember and typing command lines. CLI is important as well when you are interacting with the server itself when you can’t run any clients. Overall, it is important for increasing your productivity and adding value to your team, which ultimately increases your job security and satisfaction.