


Tuning Strategies
Let’s assume that as a DBA you are given the assignment of performance tuning in the DB2 z/OS environment. Is there more than one way to do this?
Yes, there are several. Here are five major approaches to performance tuning.
| SQL Tuning | behavior-based |
|---|---|
| Resource Constraint Tuning | resource-based |
| Application Tuning | application-based |
| Object Tuning | architecture-based |
| Systems Tuning | enterprise-based |
SQL Tuning involves SQL review as well as a knowledge of potential access paths, table and index data distribution, and statistics.
Resource Constraint Tuning is an analysis of possible tradeoffs among CPU, elapsed time, I/O, memory, network traffic, and other resources.
Application Tuning focuses attention on suites of programs that access particular tables, batch windows, and online service levels.
Object Tuning concentrates on the general definitions and configurations of tables, indexes, stored procedures, and other database objects.
System Tuning deals with the DB2 database management system infrastructure that supports all of the above.
Tools for Tuning
SMF Reporting. There are many tools that input SMF records and produce DB2 reports. These include the DB2 Performance Monitor / Performance Expert from IBM (now the “Omegamon XE for DB2 Performance Expert”) as well as others from third-party vendors.
RMF Reporting. These are reports on resource usage based on data gathered and reported by the Resource Measurement Facility. More for the advanced performance tuner, as they assume an expert level of knowledge of z/OS features. I recommend you check the manuals (“RMF Performance Management Guide” SC33-7992-04, and “RMF Report Analysis” SC33-7991-09) and read up on these reports to begin with:
Coupling Facility Activity
I/O Activity
CPU Activity
The Three Most Important Performance Reports
Often the DBA must react to production performance problems. The DBA should have a good working knowledge of the following:
- The Accounting Summary, or Accounting Short Report. This gives basic historical information about elapsed time, CPU usage, and I/Os for programs and SQL statements.
- The Explain facility allows you to report on the access path DB2 will use for an SQL statement. It contains useful information such as join methods, sorting required, and index usage.
- Health check information. This is a standard set of queries and reports executed regularly that present DB2 subsystem configuration parameters, data access patterns, index clustering, and so forth.
In addition, there are three more categories of reports that are most important.
Three More Important Performance Reports
The above three reports are most often used to diagnose short-term specific performance issues. In contrast, the next three reports are used more proactively. The DBA will look at performance of multiple applications or an entire subsystem, estimate resource usage in order to do capacity planning, and attempt to forecast future needs.
- Historical Access Path information refers to storing access paths generated by Explain. This allows the DBA to compare application access paths over time, watch for changes, and do trend analysis.
- The Accounting Long Report is a highly-detailed view of application or SQL statement execution. It is a way of drilling down beyond the summary information in the Accounting Short Report.
- Top “n” Reports. These are customized versions of standard SMF-based reports (accounting, statistics, performance, etc.) and can be used with various keywords to limit the scope of the report. Examples include the top ten (or twenty) applications that have high CPU usage, top ten long-running SQL statements, and so on.
Let’s cover these three reports in more detail.
Historical Access Paths
The Explain facility produces a report of SQL access path information in the form of rows entered into a Plan Table, a Statement Table, and other performance-related tables. These rows can be stored and maintained in a separate archive and accumulated over time. This provides the DBA with a history of DB2 access path choices for applications and SQL statements.
The DBA can then review what changes, if any, have occurred over time. This may be important for review after table or index changes, major application alterations, SQL enhancements, DB2 subsystem configuration changes, or software upgrades.
In addition to the Plan Table data, the DBA can also archive table, column, index, and statistical data, as well as key and integrity information.
This can be done by designating a “master” Plan Table in which you store all access paths, although you will need to somehow correlate access paths that change due to SQL statement number changes. (One way to do this is by implementing the QueryNo parameter on all SQL statements.) With a master Plan Table created you can now execute various queries of your own. For example:
- Join with SysTables, SysIndexes, and SysColumns (and others) to display specific columns of indexes chosen for access, but also other table indexes. You can also select statistics such as table cardinality in order to determine which queries access tables with no RunStats, tables with few or no rows, or large tables.
- Join with catalog tables SysKeys and SysRels to determine which access paths will be affected by referential integrity
- Another option is to purchase a software tool that will gather, store, and display this information.
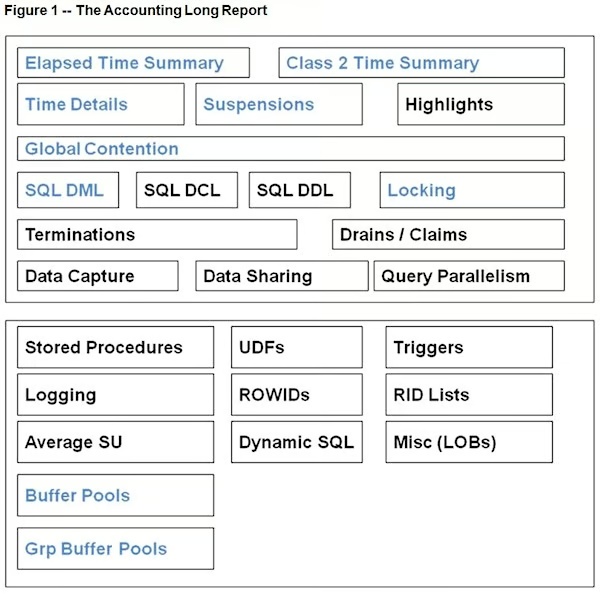
The Accounting Long Report
This report allows the DBA to drill down into plan/package details. It gives extremely detailed information about Plans and Packages. It is typically used after the DBA has referenced the Accounting Short Report and determined that there may be a performance issue.
For a quick overview of this report, see Figure 1. This diagram gives an idea of how the report appears. Some of the more commonly-referenced sections are noted in color.
Figure 1 — The Accounting Long Report
Top “n” Reports
By regularly executing and archiving Top “n” Reports the DBA can get an early warning of many problem types. For example, you may run a weekly report listing the top twenty SQL statements with high CPU usage. If one statement remains on the report for several weeks, it may indicate a tuning opportunity. If a new statement appears, it may be because something changed, such as greater data volume or a different access path.
Top “n” reports are typically customized by application type and category. On-line applications are typically short-lived, while batch applications may run for hours, so these categories should be reported separately.
Most of the SMF-based reports can be requested to display a limited number of items, so-called “Top n”. For example, you can request analysis of all packages during a time period, but only to report on the ten (or twenty, or fifty, or whatever) with the highest value of In-DB2 CPU Time, or Class 1 Wait Time, or any of a number of fields. Here is a list of some of the most useful fields:
- Elapsed Time (Application; In-DB2)
- CPU Time (Application; In-DB2)
- Class 1 Wait Time (In-Application)
- Class 2 Wait Time (In-DB2)
- Class 3 Wait Suspensions
- # DML Statements Executed
- # GetPages
- # Buffer Updates
- # Synchronous Reads
Four Common Tuning Tactics
With historical reports in-hand, there are four common methods of reviewing the information in order to performance tune an application. These are:
- Accounting Report drill-down. The DBA begins with the Accounting Short Report, looks for common issues, then references the Long Report for more details.
- Automated Top “n” analysis. Create a process that reads electronic versions of your Top “n” reports, then use simple criteria to issue exception reports.
- Constraint tradeoff. Also known as resource constraint analysis. Here, the DBA looks for constrained resources in the system, such as overloaded CPU, full disk storage devices, over-long job elapsed times, and so on. With a constraint identified, the DBA then analyzes which applications are using the constrained resource, and what other resources can be used to relieve the situation.
- Explain review automation. Historical Explain information can be analyzed by simple processes to generate reports of potential access path problems.
Of these, the accounting report drill-down is the most frequently used.
Accounting Report Drill Down
Beginning with Accounting Short Report, the DBA scans entries for applications and looks for current and potential performance issues. These might include high CPU usage, long elapsed times, high number of SQL statement issued, or a high number of I/Os.
With a few target applications identified, the DBA now reviews the Accounting Long Report. The Short Report entries take only a few lines; in contrast, an entry for an application on the Long Report can take ten pages or more! Limit execution of the Long Report to target applications only.
Where to Begin
No matter what areas of tuning you decide to begin with, one thing is certain: you will have a lot of work to do! To reduce your workload you should concentrate on automating any reporting or analysis processes. One good place to begin is to set up, review, and automate your “Top n” reports.
Chose the the report or reports relevant to your tuning area and implement a regularly-scheduled process to produce the reports. Schedule regular meetings to review the results with the appropriate people.
For example, if you are concentrating on SQL tuning, set up regular reports of your Top Ten (or fifty) SQL statements. Chose your criteria for reporting: Total elapsed time, total CPU time, and total synchronous I/O wait time are common items. Run these reports daily or weekly and review them with your peers or with the proper application area.
Review available health checks and/or develop your own. Run them regularly and review them. Develop plans to address issues when they arise.
Even the most frugal shops have tools that may help you. Discover what IBM and third-party tools exist and determine if they can help you get your job done. Pick what looks like the most useful tool and learn it.