


Introduction
Power Query is an Excel add-in that can be used for data discovery, reshaping the data and combining data coming from different sources. Power Query is one of the Excel add-ins provided as part of Microsoft Power BI self-service solution.
You can think of an ETL tool built into your familiar Excel to search or discover data from a wide variety of data sources (both from your enterprise as well as from online public data sources). Power Query has an intuitive and interactive user interface which can be used to search, discover, acquire, combine, refine, transform and enrich the data.
In my last article, “Understanding Microsoft Power BI – Self Service BI Solutions”, I talked in detail about the Microsoft Power BI self-service solution and different components to it. In this article, I am going to discuss Power Query, how to install it and how to get started using it.
Installing Power Query Excel Add-in
Power Query (code name for this feature was “Data Explorer”) is a free Excel add-in (supported both in Excel 2010 and Excel 2013) which can be installed from the ‘Download Microsoft Power Query for Excel page. To install the Power Query add-in, you require Microsoft Office 2013 Professional Plus, Office 365 ProPlus, Excel 2013 Standalone or Microsoft Office 2010 Professional Plus with Software Assurance. You can find more information on this under the Software Requirements section of Microsoft Power Query for Excel.
Once installed, you need to go to File menu and click on Options as shown below, to enable the add-in for use:
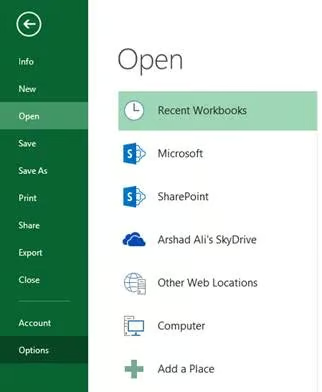
Go to File menu and click on Options
Click on the Add-Ins tab on the left side and then from the Manage combo-box, select COM Add-Ins as shown below and the click on Go button:
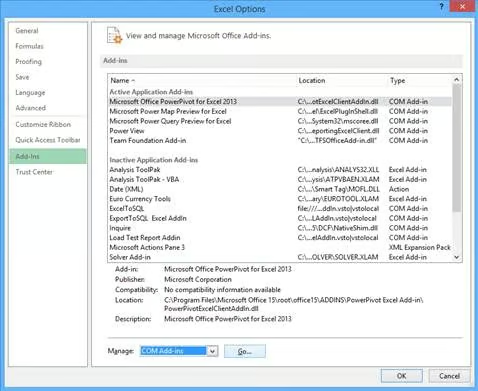
Select COM Add-Ins
On the COM Add-Ins dialog box, check “Microsoft Power Query Preview for Excel” and then click on OK button:
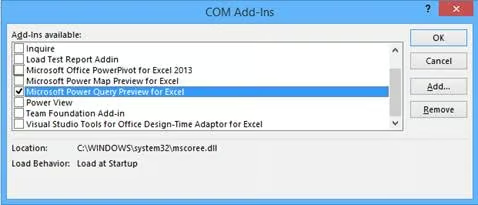
COM Add-Ins dialog box
Now you can see the POWER QUERY tab appear in Excel, as shown below:
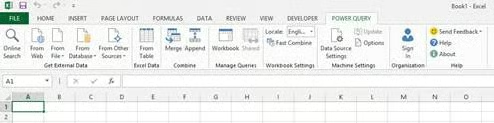
Power Query Tab
Getting Started with Power Query for Excel
Power Query allows users to search or discover data across the enterprise or from valuable public data sources available online as well as from a variety of other data sources. It allows you to bring in data into Excel from virtually any type of data sources as listed below:
- From the web
- From a file – Excel, CSV, XML, Text or Folder that contains files with metadata and links
- From a database – SQL Server, Windows Azure SQL Database, Access, Oracle, IBM DB2, MySQL, PostgreSQL and Teradata
- From other data sources – SharePoint List, OData feed, Windows Azure Marketplace, Hadoop Distributed File System – HDFS, Windows Azure Blob storage, Windows Azure Table storage, Active Directory and Facebook
Apart from the above data sources, Power Query allows you to search data publicly available online or published data from your organization. This online search of data, along with data integration from the above types of data sources, makes it a real quick ETL tool built right inside your Excel.
Let me show you some of the examples, how to use it. Under POWER QUERY tab, click on Online Search icon as shown below:
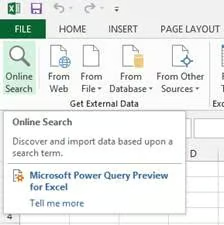
Online Search Icon
This will bring up the online search dialog box on the right side in the excel workbook as shown below:
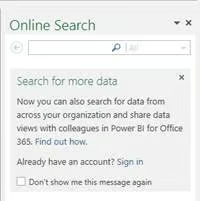
Online Search Dialog Box
Now if I search for anything, I will get the results back here as you can see below. I searched for “World population” and within few seconds, I have world population data from public data sources right in my excel workbook. As you can see, 331 results were returned for the term that I searched, from different public online data sources including Wikipedia. Hovering on any of these search results will give you a nice preview of the data. With this, even before you bring data into your excel sheet, you can verify the data you need and if it suits your need you can bring it into Excel for further usage.
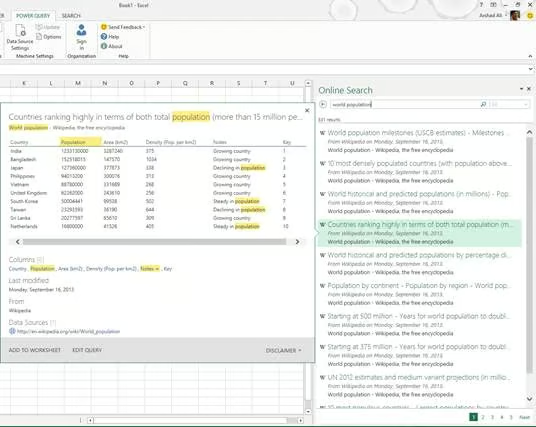
Search Results
If I mouseover other results I can see a preview of that dataset, all on the fly or instantly.
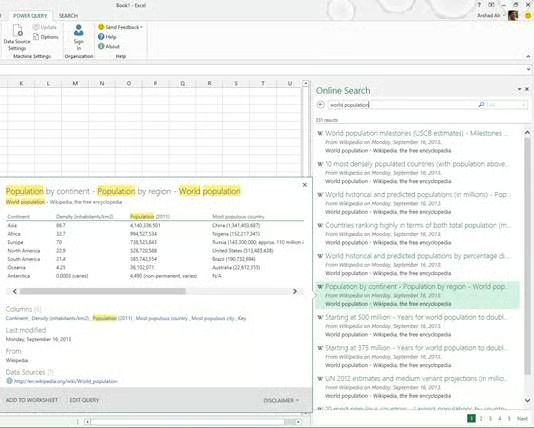
Mouseover Preview
On the bottom of the preview screen, you can see these three options:
- Add to worksheet – This option allows you to add the data to your excel worksheet and then you can use it in your own way.
- Edit Query – This option allows you to modify the query before you get data into the Excel worksheet or share it with others if required. More on this in the next section.
- Disclaimer – This option displays terms of usage of this publicly available data.
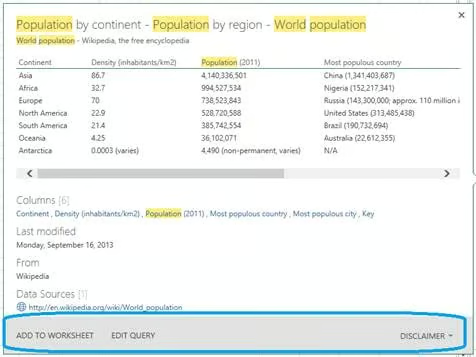
Preview Options
Clicking on Edit Query takes you to another screen where you can redefine your query to select data as per your need or usage; for example I don’t need Notes and Key columns of the data from the dataset returned, hence I can select them and then remove them from the view. There are other options available as well, for example you can apply grouping, you can replace some specific value with the value you want, you can apply different transformations, remove duplicates, merge data, append data, etc. This is really a powerful feature, which comes in handy and allows you to bring the data in the shape you would like to use it. Once you are done, you can apply your changes and close the screen to return to the previous screen:
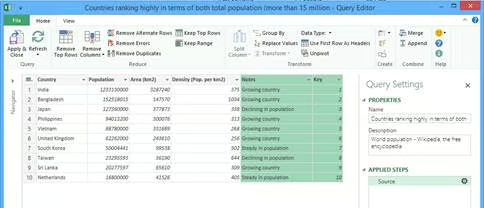
Previous Screen
Now as you have data in the Excel worksheet you can use any of the available features of Excel to refine it and create reports as per your need:
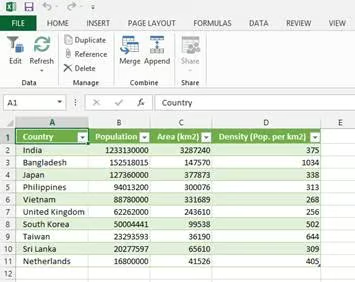
Excel Worksheet
For example, based on the data I have, I want to create a pie-chart report; to do that I just need to select data, go to Insert tab and click on the pie-chart icon and I can see a pie-chart report created for me on the fly for my data as seen below.
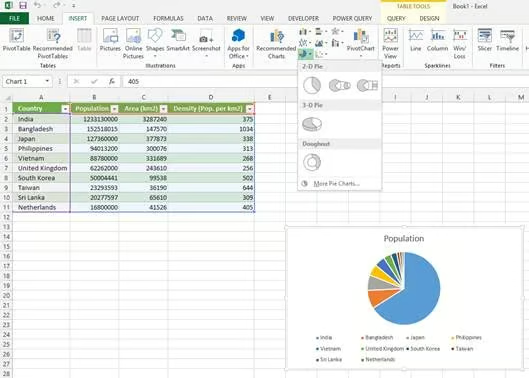
Pie-chart Report
Searching Organization Data or Sharing it with Others
To search data across your organization, you need to first sign-in using your corporate credential using the Sign In option as shown below:
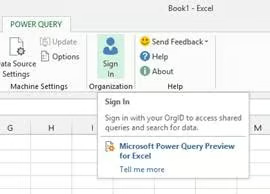
Sign In Option
Once you are signed in using your corporate credential, you can see an option to search data from your organization (notice the combo-box on the right) that has been shared/published by your IT department for consumption by others:
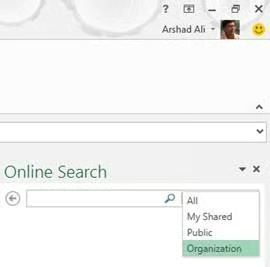
Online Search >> Organization
Once you are connected to the required data source, you can improve (filter, shape, and transform) the data to match your requirements; then you can share the metadata of the resultant dataset as a query with all users or a specific set of users within the organization, so that they can use it as is, without having to duplicate your steps.
To share queries, your need to first select the table\data, then you will see the Query tab; go to the Query tab, click on Share as shown below:
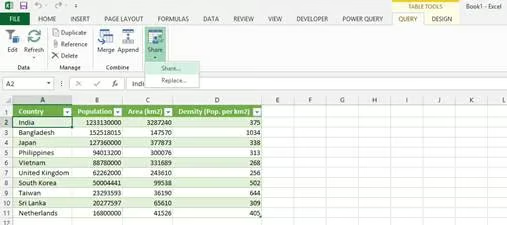
Click on the Query tab
All of the shared queries appear in the search results when users perform an online search. This enables the users to easily discover and reuse the shared queries and their underlying data (already filtered, shaped, and transformed). You can learn more about sharing queries at Share Queries.
Please note, Power Query is in Preview stage right now and features mentioned in this article might change in the final release of the product.
Conclusion
Power Query is a free Excel add-in, which can be used for data discovery, reshaping the data, transforming the data and combining data coming from different sources. In this article, I talked about how to install the Power Query add-in and how to get started with using Power Query for data discovery.
Resources
Microsoft Power Query for Excel Help
Power BI for Office 365
Review my last article, “Understanding Microsoft Power BI – Self Service BI Solutions” on this series.