


SQL Server Service Broker (SSBS) is a new architecture (introduced with SQL Server 2005 and enhanced further in SQL Server 2008 and later versions) that allows you to write asynchronous, decoupled, distributed, persistent, reliable, scalable and secure queuing/message-based applications within the database itself.
In recent articles I talked about different Service Broker objects and how to develop Service Broker applications. Now let’s see how we can manage, monitor and troubleshoot Service Broker environments.
Problem Statement
Service Broker applications run in the background. You send a message and your command returns immediately. In the background, Service Broker keeps on trying to send the message to the destination service (Queue) until it puts the message there, times out or you end the conversation. These things all happen transparently to you and your sending application. So how would you troubleshoot your Service Broker applications if they’re not working as expected, and how would you identify if something goes wrong?
Service Broker – Catalog Views
Service Broker has host of different catalog views you can use to get the metadata information about all the Service Broker objects, some of which are listed here:
| Catalog view | Description |
|---|---|
| sys.service_message_types | This catalog view gives information about the Service Broker Message Type created in the current database, including the validation type to be used and XML Schema Collection Id. |
| sys.service_contracts | This catalog view gives information about the Service Broker Contract object created in the current database. |
| sys.service_contract_message_usages | This catalog view gives information about the Service Broker Contract and Message Type association in the current database. |
| sys.service_contract_usages | Provides information about the Service Broker Contract and Service association in the current database. |
| sys.service_queues | Provides information about the Service Broker Queue in the current database, including name of the activation stored procedure, maximum number of instances of activation stored procedures that can be created, whether the queue is enabled or disabled, etc. |
| sys.service_queue_usages | Provides information about the Service Broker Queue and Service association in the current database. Please note a service can be associated with only one queue, whereas a queue can be associated with more than one services if required. |
| sys.services | Provides information about the Service Broker Service objects created in the current database. |
| sys.routes | A route is a means to locate the target service. This catalog view gives information about the Service Broker Route object created in the current database. |
| sys.conversation_priorities | Service Broker allows you to define the priority for your conversation group. This catalog view gives information about the Service Broker Conversation Priority object created in the current database. |
| sys.conversation_groups | Provides information about the Service Broker Conversation Group object created in the current database. |
| sys.remote_service_bindings | A remote service binding defines the credential to use while initiating a conversation with a remote service outside SQL Server instance. This catalog view gives information about the Service Broker Remote Service Binding object created in the current database. |
| sys.conversation_endpoints | A conversation has two endpoints represented by Initiator and Target. This catalog view gives the information about the conversation endpoints created in the current database. Also it indicates the state of those endpoints; e.g., conversing, error, closed, etc. |
| sys.transmission_queue | A transmission queue is a special internal table of Service Broker in which messages get stored if they could not be written to target queue because of any issue. Messages are first put in transmission queue if the target is outside SQL Server instance and are sent from there. Once the Service Broker on Initiator receives the acknowledgement from the target service, message is removed from the transmission queue only then. |
Service Broker – Dynamic Management Views
Service Broker has host of different dynamic management views you can use to get runtime values or monitor the Service Broker applications, some of which are listed here:
| Dynamic Management Views | Description |
|---|---|
| sys.dm_broker_queue_monitors | Service Broker creates a Queue Monitor for each queue if the activation is enabled on the queue. A queue monitor manages activation for a queue. This DMV returns a row for each queue monitor in the instance. |
| sys.dm_broker_activated_tasks | This DMV gives information on stored procedures started by Service Broker’s Queue Monitor as activation. |
| sys.dm_broker_connections | This DMV gives information about the network connection established by Service Broker, including the state of the network connection. |
| sys.dm_broker_forwarded_messages | This DMV gives information about the message which SQL Server instance forwards (if you are using message forwarding). |
Service Broker – SQL Profiler Trace Events
SQL Profiler has several trace events to monitor the health of running Service Broker applications. These events are generated on the occurrence of some events: Broker:Activation event is raised when a queue monitor starts an activation stored procedure, Broker:Queue Disabled event is raised when a queue gets disabled because of occurrence of poison message, and so on. For complete list of events and descriptions, you can click here.
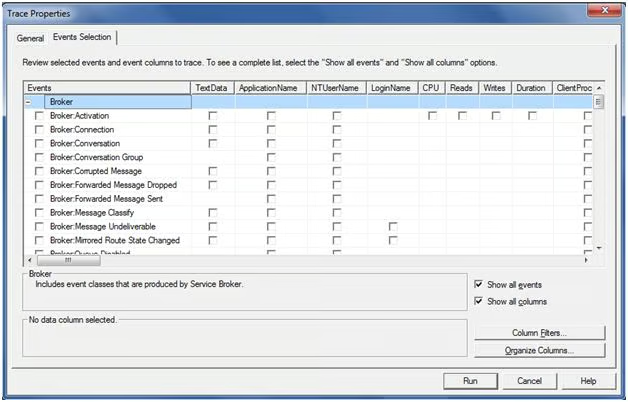
Figure 1 – Service Broker Trace Events
Service Broker – Performance Counters
Service Broker has several performance counters you can capture to monitor the health and performance of your Service Broker applications. For example, SQLServer:Broker Activation performance counter group (or object) has counters to report information about activation stored procedure, SQLServer:Broker/DBM Transport performance counter group has counters to report networking information (i.e., message fragments sent and received) and database mirroring, etc. For details, click here.
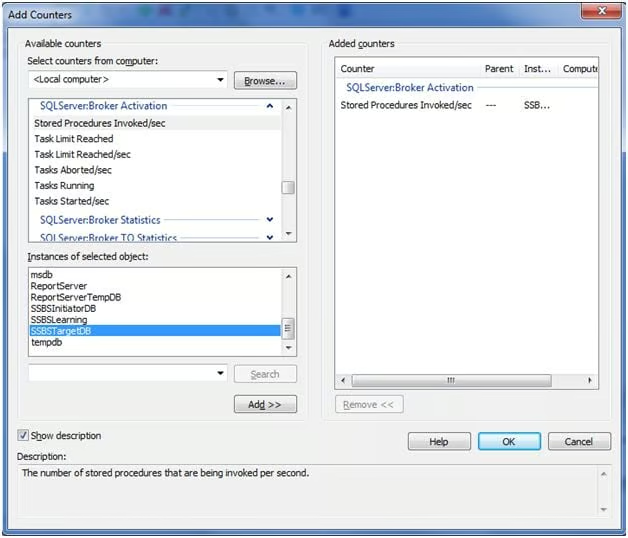
Figure 2 – Service Broker Performance Counters
Service Broker – Diagnostic Tool
Starting with SQL Server 2008, Service Broker provides a utility called ssbdiagnose, which is used to troubleshoot a problem in conversation between two services, or a problem of configuration in either one or two services that you can verify in a newly configured SSBS application or after any changes in the configuration of an existing SSBS application. To learn more about this command, click here.
If your queue gets disabled automatically again and again, then it might be because of the presence of poison messages in the queue. By default, Service Broker handles poison messages (POISON_MESSAGE_HANDLING), which means it disables the queue when some offending messages cause transaction to rollback for 5 times. Starting with SQL Server 2008 R2 you can disable this default behavior if you have setup custom poison message handling mechanism in place.
Conclusion
In this article I talked about means and tools to manage and monitor Service Broker activities. I also talked about troubleshooting Service Broker applications if they’re not working as expected.
Resources
MSDN Server Broker Trace Event Category
MSDN Service Broker Performance Counters
MSDN Removing Poison Message