


In my An Overview of the MySQL Performance Schema article, I talked about a relatively new tool called the Performance Schema. Initially implemented in MySQL 5.5 and further improved for MySQL 5.6, the Performance Schema is a tool for monitoring MySQL Server execution at a low level while having minimal impact on server performance. The Performance Schema, aptly named “performance_schema”, contains 52 tables that may be queried to analyze the performance of all sorts of database components including indexes, threads, events, queries, temp tables, and more.
While proving to be in indispensable tool to DBAs, its use is not as straightforward as one might hope. First of all, the engine requires a lot of configuration, called instrumentation. Another drawback is that the SQL statements can be quite complex and perplexing to the uninitiated. The good news is that Oracle has been kind enough to include performance tools in the MySQL Workbench. They were first introduced in version 6.1.0 with the latest version being 6.2.4. In today’s article, I’ll be giving an overview of MySQL Workbench Performance reports.
Download the Latest and Greatest
I would highly encourage you to download it because each new version has improved significantly. Just go to the Workbench 6.2.4 download page and pick the one for your operating system. It’s available for most OSes, including:
- Windows 7 32 and 64bits
- Mac OS X Lion or newer
- Ubuntu 12.04 LTS and Ubuntu 14.04 64bits
- Fedora 20 64bits
- Oracle Linux 6.5 and 7 64bits
A couple of things to take note of:
1. Workbench for Windows requires the Microsoft .NET Framework 4 Client Profile as well as Visual C++ Redistributable for Visual Studio 2013. Regarding the latter, I encountered an interesting issue. I had previously installed the 2010 C++ Redistributable and still had the installation file in my Downloads folder. When I was prompted by my browser whether or not I wanted to overwrite the file, I erroneously assumed that I must have installed it already. After a few failed attempts at running the Workbench installation I finally realized that the 2010 and 2013 Redistributables had the same file name: “vcredist_x86.exe”! The lesson here is that the presence of the “vcredist_x86.exe” file does not mean that you have installed the latest version. To be on the safe side, run it anyway; if you did already install it, the install wizard will ask you if you’d like to repair or remove that version. You can cancel the install at that point.
2. Pre-compiled binaries are no longer provided for 32bit Linux distributions, but you can still download and build from sources.
Configuring the Performance Schema
Launch the Workbench and take a look at the Navigator pane on the left-hand side of the UI and you’ll see a PERFORMANCE section with three links: Dashboard, Performance Reports, and Performance Schema Setup. The first time that you click the Performance Setup link, you’ll encounter a screen that states that the performance Schema helper schema (sys) is not installed.
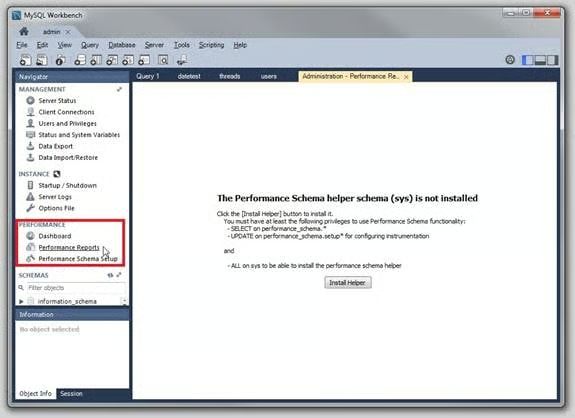
Performance Schema helper schema (sys) is not installed
All you need to do is click the Install Helper button and an installation script does the rest, provided of course that you have sufficient permissions to use the Performance Schema functionality.
You’ll also have to enable the Reports before you can use them.
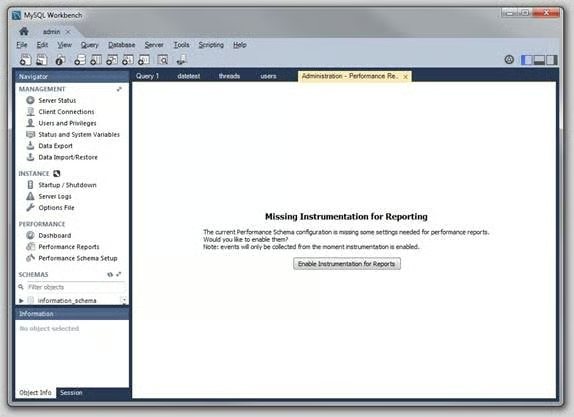
Enable Instrumentation for Reports
Now comes the actual configuration.
An “Easy Setup” page comes up by default. Sliding the “Performance Schema Full Enabled” slider to YES enables all available Performance Schema instruments.
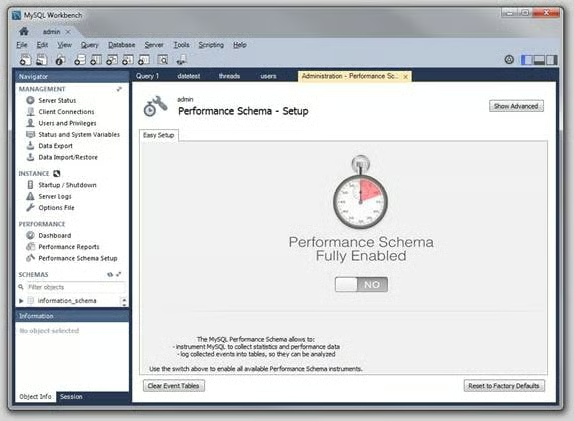
Performance Schema – Setup
That will give you a level of “Server Default” in terms of monitoring coverage. You can move the slider to a higher position if you’d like more monitoring, but bear in mind that there is a trade-off between the amount of performance monitoring and overhead. Therefore trying to monitor everything that goes on in the database at all times is not only counter-productive, but overkill as well.
Performance Schema Slider
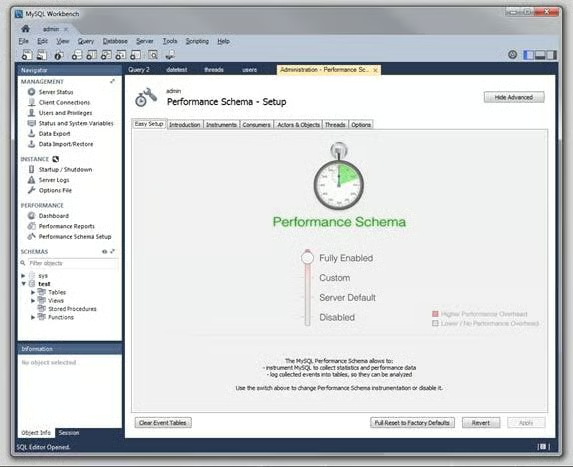
To customize the monitoring coverage, you can click the Show Advanced button in the top-right corner of the screen:
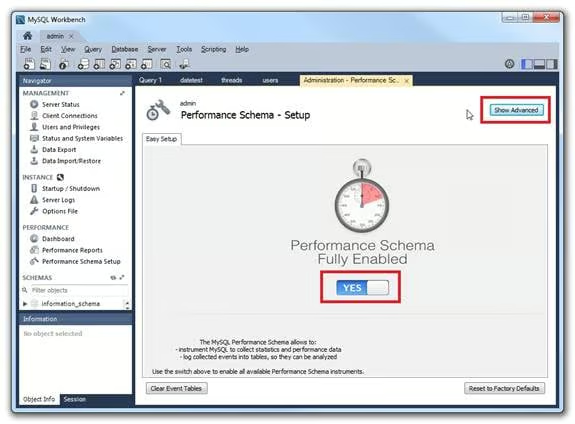
Show Advanced Button
That will make the other tabs appear:
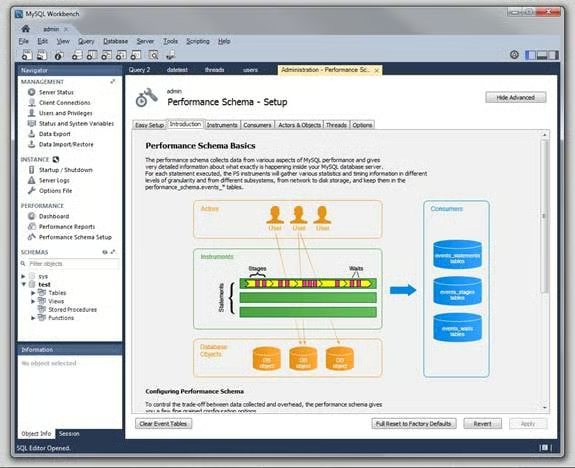
Performance Schema Tabs
Running Reports
The stars of the 6.x Workbench are the canned Performance Reports than can help you to quickly pinpoint bottlenecks in your databases.
The reports are grouped together by the following expandable/collapsible headers:
- Hot Spots for I/O
- High Cost SQL Statements
- Database Schema Statistics
- Wait Event Times (Expert)
- InnoDB Statistics
To run a report, just click the name in the Report tree. The results will then appear to its right. Here are the results for the Unused Indexes report:
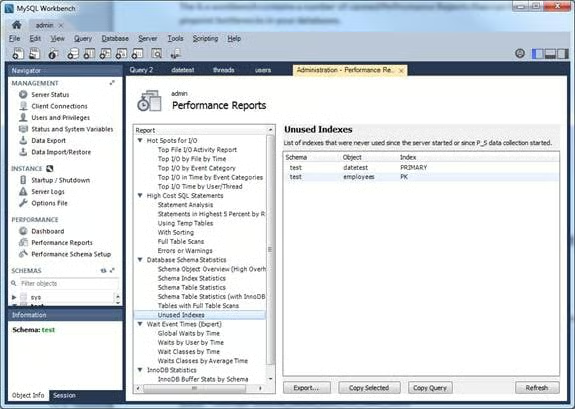
Unused Indexes Report
Retrieving the SQL Statement
There are some buttons at the bottom of the screen that provide some useful functionality. For instance, you can obtain the SQL statement used by clicking the Copy Query button. The code for this report is:
select *
from sys.`schema_unused_indexes`
You can also export the report as a plaintext file via the Export… button. A dialog lets you choose the name and directory in which to save the file. Note that is does not provide an extension for you, so you have to include it yourself if you want one. Here is the exported Unused Indexes report above:
Unused IndexesSchema, Object, Indextest, datetest, PRIMARY
test, employees, PKThe Copy Selected button can be utilized to copy part of the report to your clipboard.
To rerun the same query, click the Refresh button.
Statements in Highest 5 Percent by Running Time
This report is found under the High Cost SQL Statements heading. It shows the slowest-running queries. You can change the sort order by clicking on a column header. To order the queries so that the slowest one occupies the top row, click on one of the time headers so that the arrow points down:
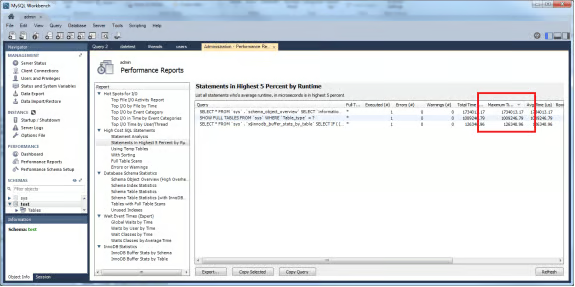
Click on One of the Time Headers
Luckily for me, all of the slowest statements are for the sys view, which is part of the Performance Schema! That’s OK because it uses its own engine.
In case you’re interested, here is the SQL statement. It’s actually quite simple!
select *
from sys.`x$statements_with_runtimes_in_95th_percentile`Conclusion
For us DBAs who were weaned on graphical interfaces, the MySQL Workbench’s Performance Reports offer a quick and easy way to gather information on common database bottlenecks. Now all we need is a tool to help use create our own reports…