


As mentioned in a
previous article, there is more than one approach or tool to use in a
“tuning opportunity.” Ideally, the opportunity occurs before code has gone into
production, but as we’re all aware of, a lot of time spent on tuning code takes
places in production. Context is always important to keep in mind. What may
look good may in fact be not so good, and vice versa.
Tracing and TKPROF
Shown below is the TKPROF’d
output from three SQL statements. What can you deduce about the statements,
that is, were these DML (insert, update, delete) or select(s)? In the formatted
output from the trace file used to create this report, you’d obviously have the
statements right there, so no guess work is involved at all. However, that’s
not the point of this question. The point is to separate what you see (or read)
versus what you understand. The data set used throughout is based on the SH
demo schema in 10gR2. The code used to generate the output will be shown later.
Some questions about the
output:
- What is the general nature/type
of each statement? - What parameter is used to enable
timing information, what is it set to, and when set, which column does it
populate?
call    count     cpu   elapsed       disk     query   current      rows
——- —–  —— ——— ———- ——— ———  ——–
Parse        1    0.06     0.06          0         0         0         0
Execute      1    0.00     0.00          0         0         0         0
Fetch       92    7.67    15.92      15645     24160        11    918843
——- —–  —— ——— ———- ——— ———  ——–
total       94    7.73    15.99      15645     24160        11    918843
call     count    cpu   elapsed       disk     query   current      rows
——- —–  —— ——— ———- ——— ———  ——–
Parse        1    0.00     0.00          0         0         0         0
Execute      1    0.00     0.00          0         0         0         0
Fetch     9189    3.78    14.06      15214     12741        11    918843
——- —–  —— ——— ———- ——— ———  ——–
total     9191    3.78    14.06      15214     12741        11    918843
call     count    cpu   elapsed       disk     query   current      rows
——- —–  —— ——— ———- ——— ———  ——–
Parse        1    0.00     0.00          0         0         0         0
Execute     92   48.89    88.66       7619   1799287   3607477    918843
Fetch        0    0.00     0.00          0         0         0         0
——- —–  —— ——— ———- ——— ———  ——–
total 93 48.89 88.66 7619 1799287 3607477 918843Table 1 – TKPROF formatted trace file output
The top two rows both
represent select statements. Each statement was parsed once (the shared_pool
was flushed ahead of time) and executed once. The number of rows fetched is
just over 918,000, and is the same for both. In this case, the number of rows
returned should be the same since the same statement was used in both examples.
We get cpu time for free,
and elapsed time is present (has values) when TIMED_STATISTICS is set to true. Given
that the two statements were the same, why would there be such a difference in
the fetch count?
Discounting the difference
between the elapsed times (they’re fairly close anyway, and the reason for the
difference is also forthcoming), and using the same select statement, we know
something was different in terms of how the select was performed. The
table below may be enough of a clue as to the reason why.
| Rows/group size | Results |
|---|---|
| 918843/10000 | 91 groups of 10000 with remainder 8843 |
| 918843/100 | 9188 groups of 100 with remainder 43 |
Table 2 – Rows versus fetch counts
In the top row, it would
take 92 fetches to account for 918843 rows. In the bottom row, it is 9188 plus
one more, or 9189. The group sizes are arrays, so what was done in the first
operation caused/enabled Oracle to fetch the rows 10000 at a time. Likewise,
something caused Oracle to fetch only 100 at a time for the second version.
Time to see what the code looks like.
The select statement (within
the procedures shown) below simply gets min, max, sum and count based on the
product ID in the SALES and PRODUCTS tables. I added several extra columns to
the SALES table, and these are used for the update. If you want to replicate
this on your database (assuming you have the demo
schemas installed), modify the SALES table as so:
alter table sales add (
days_sold number,
number_sold number,
first_sold_date date,
last_sold_date date,
last_updated date);
When finished, drop the
columns and the schema is back to where it was (no need to reset
the data).
create or replace procedure update_sales_fact
is
   type t_rowid is table of rowid;
   type t_nos   is table of sales.quantity_sold%type;
   type t_qs    is table of sales.quantity_sold%type;
   type t_fsd   is table of sales.time_id%type;
   type t_lsd   is table of sales.time_id%type;
   v_rowid       t_rowid;
   v_nos         t_nos;
   v_qs          t_qs;
   v_fsd         t_fsd;
   v_lsd         t_lsd;
   v_date        date := sysdate;
   cursor c is
   select s.rowid
        , sum(s.quantity_sold) number_sold
        , count(distinct s.time_id) days_sold
        , min(s.time_id) first_sold_date
        , max(s.time_id) last_sold_date
     from sales s
        , products p
    where s.time_id > ’31-DEC-97′
      and s.prod_id = p.prod_id
    group by s.rowid;
begin
   open c;
   loop
      fetch c
         bulk collect into v_rowid, v_nos,
                           v_qs, v_fsd, v_lsd
         limit 10000;
      begin
         forall i in v_rowid.first..v_rowid.last
            update sales
               set days_sold       = v_qs(i)
                 , number_sold     = v_nos(i)
                 , first_sold_date = v_fsd(i)
                 , last_sold_date  = v_lsd(i)
                 , last_updated    = v_date
            where rowid = v_rowid(i);
      end;
      exit when c%notfound;
   end loop;
close c;
end;
/The second use of the same select
statement:
create or replace procedure update_sales_fact2
is
   v_date date := sysdate;
   cursor c is
   select s.rowid upd_rowid
        , sum(s.quantity_sold) number_sold
        , count(distinct s.time_id) days_sold
        , min(s.time_id) first_sold_date
        , max(s.time_id) last_sold_date
     from sales s
        , products p
    where s.time_id > ’31-DEC-97′
      and s.prod_id = p.prod_id
    group by s.rowid;
begin
  for r in c loop
    update sales
    set days_sold     = r.days_sold
    , number_sold     = r.number_sold
    , first_sold_date = r.first_sold_date
    , last_sold_date  = r.last_sold_date
    , last_updated    = v_date
    where rowid = r.upd_rowid;
  end loop;
end;
/
The bulk collect with a
limit of 10,000 is what accounted for the 92 fetches. The basic cursor for loop
in the second code listing resulted in an array size of 100. But doesn’t the
cursor for loop process just one record at a time? Yes and no. Yes, in that
what is coded looks that way, but no in that with PL/SQL in Oracle10g, we get a
“free” bulk collect using a limit of 100.
The last row in Table 1 is
from an update statement, and is the update step using the collection defined
in update_sales_fact. Note that in the update, there are no fetches. We’re not
fetching rows at this point, so the fetch count should be zero. Let’s compare
the difference between the updates based on the collection and the cursor for
loop.
| Using the collection (repeated from Table 1) |
|---|
|
| Using the cursor for loop |
|
With the collection, the
update statement was executed 92 times as opposed to one time for each and
every record used in the cursor (918,843 times).The elapsed time difference is
also significantly larger now. In other words, we’re seeing the cost of doing
business using less efficient code.
Let’s suppose you get the
dreaded call from a user (“My query is taking longer now, what’s wrong with the
database?”). Since you happened to have base lined this particular query, you
pull up the tracing and explain plan information for it (the query is not shown,
as it is the same one we’ve been using). We note that Oracle uses an index scan
on the PRODUCTS_PK index (based on the PRODUCTS table). The SALES table is
partitioned, and based on what the query is looking for, we’re going to hit
most if not all partitions.
call     count       cpu    elapsed       disk      query    current        rows
——- ——  ——– ———- ———- ———- ———-  ———-
Parse        1      0.06       0.06          0          0          0           0
Execute      1      0.00       0.00          0          0          0           0
Fetch       92      8.42      13.53      15806      12741         11      918843
——- ——  ——– ———- ———- ———- ———-  ———-
total       94      8.48      13.60      15806      12741         11      918843
Misses in library cache during parse: 1
Optimizer mode: ALL_ROWS
Parsing user id: 69  (SH)   (recursive depth: 1)
Rows     Execution Plan
——-  —————————————————
      0  SELECT STATEMENT   MODE: ALL_ROWS
      0   SORT (GROUP BY)
      0    HASH JOIN
      0     INDEX   MODE: ANALYZED (FULL SCAN) OF ‘PRODUCTS_PK’
             (INDEX (UNIQUE))
      0     PARTITION RANGE (ITERATOR) PARTITION:KEY STOP=28
      0      TABLE ACCESS   MODE: ANALYZED (FULL) OF ‘SALES’ (TABLE)
PARTITION:KEY STOP=28This execution plan is what
we expect to see in the user’s session or by having the query explained or
traced right now. In the beginning of your investigation, what degree of detail
do you want to dive into? In other words, is using AUTOTRACE good enough or do
you want to trace the user’s session as he is running the query (or procedure
in this case)?
Using tracing, the formatted
output is:
call     count       cpu    elapsed       disk      query    current        rows
——- ——  ——– ———- ———- ———- ———-  ———-
Parse        1      0.06       0.06          0          0          0           0
Execute      1      0.00       0.00          0          0          0           0
Fetch       92      7.67      15.92      15645      24160         11      918843
——- ——  ——– ———- ———- ———- ———-  ———-
total       94      7.73      15.99      15645      24160         11      918843
Misses in library cache during parse: 1
Optimizer mode: ALL_ROWS
Parsing user id: 69  (SH)   (recursive depth: 1)
Rows     Execution Plan
——-  —————————————————
      0  SELECT STATEMENT   MODE: ALL_ROWS
      0   SORT (GROUP BY)
      0    HASH JOIN
      0     TABLE ACCESS   MODE: ANALYZED (FULL) OF ‘PRODUCTS’ (TABLE)
      0     PARTITION RANGE (ITERATOR) PARTITION:KEY STOP=28
      0      TABLE ACCESS   MODE: ANALYZED (FULL) OF ‘SALES’ (TABLE)
                 PARTITION:KEY STOP=28
By quick inspection, we can
see that the explain plan is different. For some reason now, we have a full
table scan of the PRODUCTS table. Since the index usage, or lack thereof, seems
to be the culprit, what is the status of the index? Quite a few methods can be
used to determine the status of the index; I’ll use Toad for this example.
Bring up the SH schema in
your sample database, and view indexes in the schema browser.
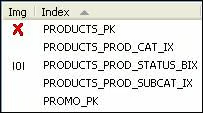
For whatever reason, the
index has been marked unusable. Rebuild it and the query’s explain plan will go
back to the baseline. While we’re at it, what else took place when the
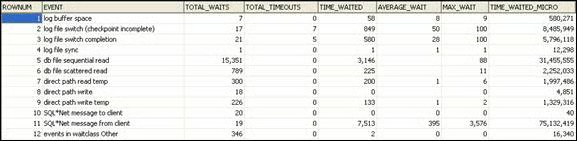
procedure was executing? Let’s look at the wait events in the update phase. Any
number of homegrown freely available on the Internet scripts can be used to
view wait events. A representative list of wait events can also be observed in
Toad.
Tracing also captures this
information:
Rows     Execution Plan
——-  —————————————————
      0  UPDATE STATEMENT   MODE: ALL_ROWS
      0   UPDATE OF ‘SALES’
      0    TABLE ACCESS   MODE: ANALYZED (BY USER ROWID) OF ‘SALES’
               (TABLE) PARTITION:ROW LOCATION
Elapsed times include waiting on following events:
  Event waited on                             Times   Max. Wait  Total Waited
  —————————————-   Waited  ———-  ————
  db file sequential read                      7621        1.15         21.60
  rdbms ipc reply                               155        0.00          0.01
  log file switch completion                     19        0.99          5.77
  log buffer space                                9        0.08          0.70
  log file switch (checkpoint incomplete)        16        0.99         10.80
  control file sequential read                   19        0.01          0.05
  Data file init write                           16        0.03          0.19
  db file single write                            1        0.00          0.00
control file parallel write 3 0.00 0.00We lost some time waiting on
log file operations. This can be confirmed by viewing the alert log:
| Alert log extract showing the wait on log file switch |
|---|
|
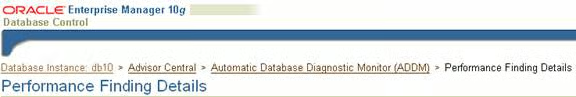
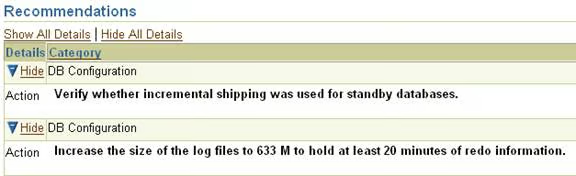
Further, Enterprise Manager
(Database Control) has also highlighted this problem in a couple of places:
![]()
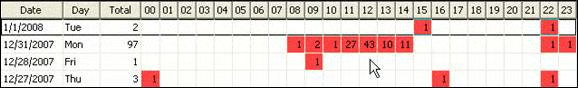
What was the log file switch
frequency like when this procedure was being run? Again, Toad provides a quick
means of visually inspecting the situation:
After drilling down into the
“Performance Finding Details” page, we see the recommendation to increase the
size of the log files. The recommendation about incremental shipping does not
apply in this case.
Okay, 633MB it is for the
redo logs. The seed database used 50MB sized log files. The update generates
10-11 log switches, so that’s 500 to 550MB of disk space. How often you run
this procedure will influence Oracle’s recommendation. The main point is this:
based on what takes place with the current code, the high switch rate can be
reduced by increasing the size of the redo logs. Less switches implies fewer
waits, and more than likely (the important part), less time spent waiting.
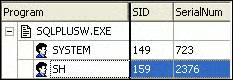
Gathering user information
Getting the user’s SID and
serial# was pulled from Toad, and tracing was done in a SQL*Plus session using
the DBMS_MONITOR built-in.
| Starting and stopping tracing in another session |
|---|
PL/SQL procedure successfully completed. SQL> EXECUTE DBMS_MONITOR.SESSION_TRACE_DISABLE PL/SQL procedure successfully completed. |
At the OS level, identify
the trace file and run TKPROF against it. This is easy to perform and is
covered extensively elsewhere.
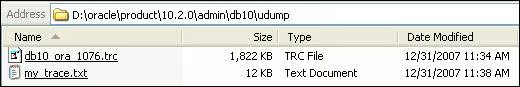
| Running TKPROF on the trace file |
|---|
Directory of D:\oracle\product\10.2.0\admin\db10\udump 12/31/2007 11:34 AM 12/31/2007 11:34 AM 12/31/2007 11:34 AM 1,865,565 db10_ora_1076.trc 1 File(s) 1,865,565 bytes 2 Dir(s) 48,742,436,864 bytes free D:\oracle\product\10.2.0\admin\db10\udump>tkprof db10_ora_1076.trc my_trace.txt sys=no TKPROF: Release 10.2.0.3.0 – Production on Mon Dec 31 11:38:28 2007 Copyright (c) 1982, 2005, Oracle. All rights reserved. D:\oracle\product\10.2.0\admin\db10\udump> |
In Closing
This was an obviously easy
tuning problem, but what it has in common with more complex problems is the
same set of tools and analysis behind it. We navigated through SQL*Plus, Toad,
Enterprise Manager, TKPROF, and a report out of Advisor Central. What were the
indicators of things gone awry or of what could be better?
The time spent on sequential
reads versus scattered reads – the times by themselves have to be taken into
context with what you expect to be taking place. If you’re expecting an index
to be used, but the scattered reads are high, or conversely, the sequential
reads seem to be low, this is one of the key wait events to consider. Were
direct path read and write waits expected (if you run these procedures, these
two events will appear in the select phase)? Again, context matters, because
partitions were involved.
Out of all the wait events
shown, the log file related ones were not expected. After increasing the log
file member sizes, the log file switch went away.
| Fixing the redo log file size |
|---|
|
| Wait events in the update statement after increasing the redo log size |
|---|
|
So, had a user come to you
complaining about a procedure taking longer than normal, not only could you
have fixed the root problem (fix the index), but you also could have fixed
another bottleneck (log files being too small). Assuming you made the changes
to the redo log member size, were you justified in doing so? Again, context
matters. When was the procedure being run? Switching every 20 minutes or so
also depends on when during the day, that is, during normal business hours or
someone running this late at night when few other users are logged on.
Before you can sort out
which events are truly problematic, you need to be able to investigate them
with one or more tools. Being able to seamlessly move around and use various
tools should be second nature. You want to focus your efforts on identifying
problems, not on identifying why a tool isn’t working for you.