This article is the third and last in the three part series,
that has explored the use of VARRAYs in Oracle. This part will look at the
performance implications if you should choose to use VARRAYS.
In Part I&II of this series, we learned how to create
the abstract data types and use them to our advantage for modeling purposes.
They were pretty slick and could handle some interesting scenarios when moving
data around. We also learned that we could easily hide the complexity of the
abstract structures from our end users to make the abstract data types very
easy to use. However, in this article we turn our focus to how these structures
will behave when we actually use them. Will they improve the performance or
bring our systems to their knees. Let’s walk through a few different scenarios
and show the effects of using VARRAYs.
The Players
1. The
table called GAS_LOG, defined with and without a VARRAY. See the first
and second
part of this series if need be.
2. A
non-unique b-tree index on GAS_LOG table for VIN number.
3. A
source table of 50,000 rows where each row is a unique VIN number. This table
will be cycled through 20 times to simulate 20 different gas logs added for
each VIN defined. This will amount to a 1 million-row table.
The Simple Test
For our test, we will be determining the response time, wait
time, and a breakout of the CPU used. Table 1
shows the three test scenarios we will use and what they entail. The last two
require a PL/SQL procedure which can be found in Listing
1.
Table 1
Test Scenarios
|
Scenario |
Descriptions |
|
INSERT…SELECT |
This is a simple insert into…select from statement and |
|
PL/SQL Cursor on Regular Table |
This will open a cursor (20 times) on the source table and |
|
PL/SQL Cursor on Table with VARRAY |
This will open a cursor (20 times) on the source table and |
Definition Level Set
Before we go any further in this, I have provided a few
quick definitions in Table 2 to give you
insight into what we will be measuring. I have zeroed in only on these items
because at a high level they are what matters to the end user and directly
impact what the end user will see as response from the system. Please note that
response time is the summation of the CPU times plus the Wait time. Also, note
that parse time and recursive time are components of the total CPU used.
Table 2
Important Response Time Statistics
|
Response Time |
The amount of |
|
CPU used by |
Total amount |
|
parse time CPU |
Total amount |
|
recursive CPU |
Total amount |
|
Wait Time |
Total amount |
Comparing Inserting Data
In the following scenarios, you will see the top level wait
events along with the amount of CPU that was used to produce the inserts into
the tables. While there were other wait events with some time associated to
them, they were not very much and did not impact the results that I saw. Table 3 shows you a quick overview of the
statistics and how the different scenarios compare to one another. A few
gleaming insights can be noted:
1. If
it were not for the PL/SQL code doing recursive calls the cursor and inserting
into the table without the VARRAY would almost be as quick as the straight
inserts.
2. For
the VARRY object, all the times were much more than any operation on a normal
table. Remember, if you want to look back at Part I&II of this series, that
there is more PL/SQL code to handle the inserting into the VARRAY table and we
must read the VARRAY into memory before we can change it and update it.
Table 3
Overview of Statistics Gathered
|
Method |
Response Time |
CPU Used |
Parse Time CPU |
Recursive CPU Usage |
Time Waited |
|
INSERT…SELECT |
02:41 |
00:17 |
:0002 |
:0007 |
02:24 |
|
PL/SQL Cursor on Regular Table |
07:06 |
03:49 |
00:28 |
03:23 |
03:17 |
|
PL/SQL Cursor on Table with VARRAY |
36:33 |
23:33 |
01:43 |
22:50 |
13:00 |
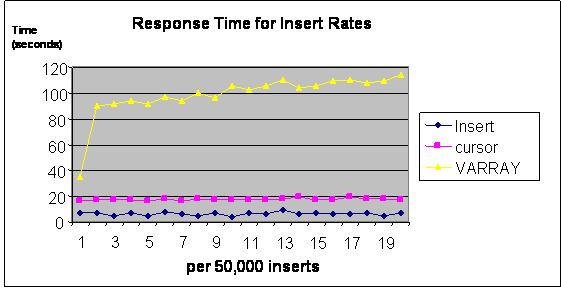
While performing the inserts,
50,000 at a time for 20 cycles, I decided to take a look at the segregation of
the insert rate. As you can see from Table 4 there was not really any
derogation for the straight insert or PL/SQL cursor methods. Unfortunately, the
more entries we put in the VARRAY in our table, the more time it took. As you
can also see, the very first insert we did had the best response time but still
was not even close to what the other methods provided. Moreover, it just went
downhill (upslope) from there.
Table 4
Graph of Response Time for each
set of Inserts over time


