As I’ve been introducing you to the IBM Data Studio
integrated development environment (IDE) that’s new with DB2 9.5, I’ve shown
you how to set up database
connection objects and the actions
that you can perform on them. In this article, I want to delve deeper into
the overview diagrams that I introduced you to in Part 2
of this series and show you just how powerful this feature is.
Note: In earlier
parts of this series, I referred to this toolset by its name as of the DB2
Viper 2 Beta 2 version. As you’ll see, this has now changed as DB2 Viper 2 has
been officially named DB2 9.5, and the IDE has been officially dubbed IBM Data
Studio. In Beta 1, it was referred to as Viper Studio. In this article, I’ll continue
using the newly announced names for both DB2 and the IBM Data Studio IDE. Since
the new names will have now been in effect for two parts in this series, I’ll
no longer explain the terminology change in subsequent articles.
Assumptions if you’re starting here…
I recommend that you start with Part
1 because I tend to build on the concepts introduced and objects created in
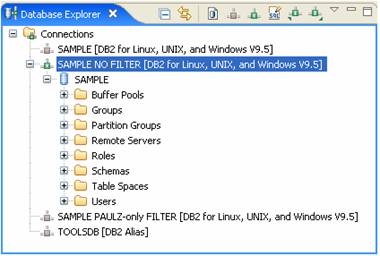
this series sequentially. For this article, I assume that you have a live database
connection to the SAMPLE database, and that this connection is filtered such
that the user account used to create the SAMPLE database is the only schema
that shows up in the Database Explorer view. For example:
Note: You can perform
most of the steps in this article without a live connection to the database, by
using a database connection object that’s been enabled for offline work. For
more information on this capability, refer to Part 2
in this series.
In addition, I assume you’ve run
the following data definition language (DDL) and data manipulation language
(DML) statements on the SAMPLE database (changing the schema to match yours):
CREATE TABLE PAULZ.DJCOUNTRIES
(COUNTRY_ID SMALLINT NOT NULL,
COUNTRY_NAME VARCHAR (50) NOT NULL,
CONSTRAINT COUNTRYIDPK PRIMARY KEY (COUNTRY_ID))
INSERT INTO PAULZ.DJCOUNTRIES VALUES
(1,’Canada’), (2,’USA’),(3,’Australia’),(4,’Greece’)
CREATE TABLE PAULZ.DJFRIENDS
( ID SMALLINT  NOT NULL  GENERATED ALWAYS AS IDENTITY
(START WITH 1, INCREMENT BY 1, CACHE 10),
FIRST_NAME VARCHAR (50),
LAST_NAME VARCHAR (50)  NOT NULL,
COUNTRY_CODE SMALLINT  NOT NULL,
CONSTRAINT PK_ID PRIMARY KEY ( ID),
CONSTRAINT FKTOCOUNTRYID_COUNTRY_CODE FOREIGN KEY
(COUNTRY_CODE) REFERENCES PAULZ.DJCOUNTRIES (COUNTRY_ID)
ON DELETE RESTRICT ON UPDATE NO ACTION ENFORCED  ENABLE
QUERY OPTIMIZATION)
INSERT INTO DJFRIENDS (FIRST_NAME, LAST_NAME, COUNTRY_CODE)
VALUES (‘George’, ‘Baklarz’, 1),
(‘Roman’, ‘Melnyk’, 1),
(‘Anastasia’, ‘Zikopoulos’, 4),
(‘Chris’,’Neilson’,3),
(‘Glen’, ‘Mosely’, 2),
(‘Cindy’,’Munns’,2)
To keep things simple: filter the tables in your schema
In Part 2
I showed you how to create an overview diagram; the generated diagram got
pretty messy because there are a lot of schema objects in the SAMPLE database. For
the purposes of this article, before you create the overview diagram (and to
keep things simple), perform the following steps:
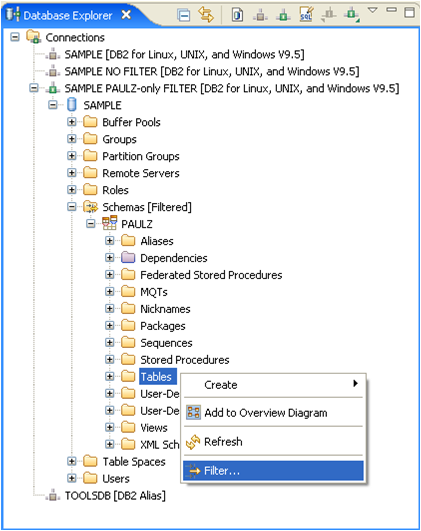
1. Select
the Tables folder, right-click, and select Filter:
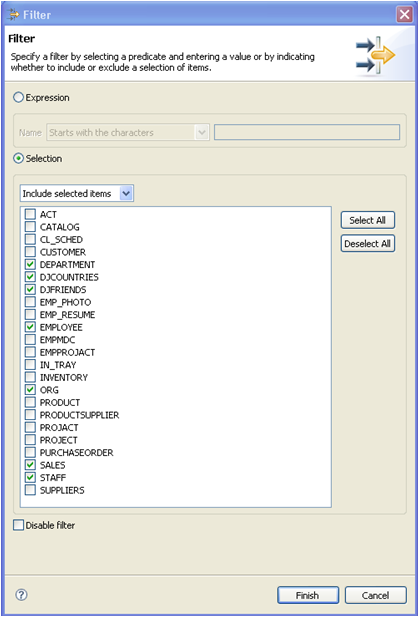
2. Enable
a table filter using the Selection option such that only the DEPARTMENT,
DJFRIENDS, DJCOUNTRIES, EMPLOYEE, ORG, SALES, and STAFF tables are displayed in
the Tables folder. Your table filter definition should look like this:
3. Click
Finish.
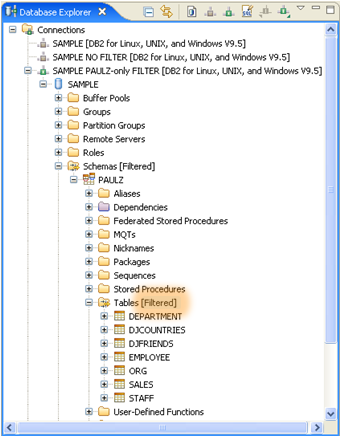
Once the filter is applied, the Database Explorer view should look similar to
this:
Creating the overview diagram
Create an overview diagram for this article using the
following steps:
1. Select
a live database connection object.
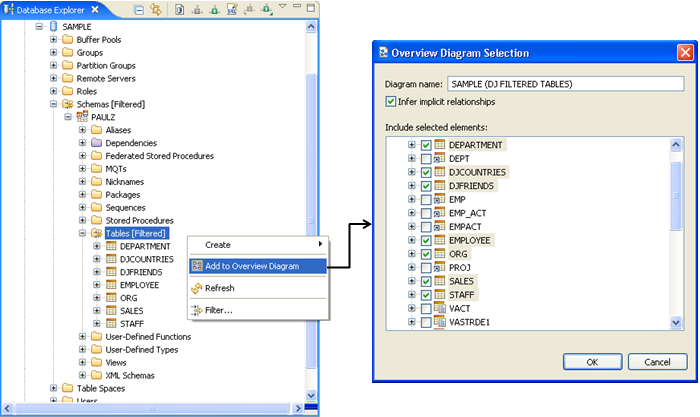
2. Expand
the database connection object tree until you locate the Tables folder,
right-click, and select Add to overview diagram. The Overview Diagram
Selection window opens.
3. Name
this overview diagram SAMPLE (DJ FILTERED TABLES) using the Diagram
name field.
4. Select
the Infer implicit relationships check box. The Overview Diagram
Selection window should now look similar to this:
5. By
default, the tables that are included via your defined filter on the Tables folder
are selected. For this article, keep the default selections and click OK.
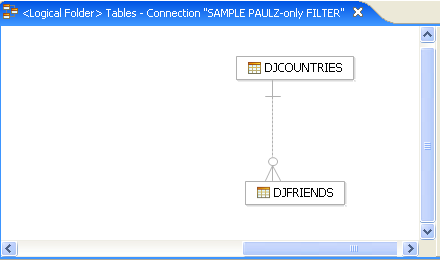
6. Adjust
the focus of your overview diagram until it looks similar to the following
figure. (You should be able to simply move the slide bar to the right to get
this view of your diagram.)
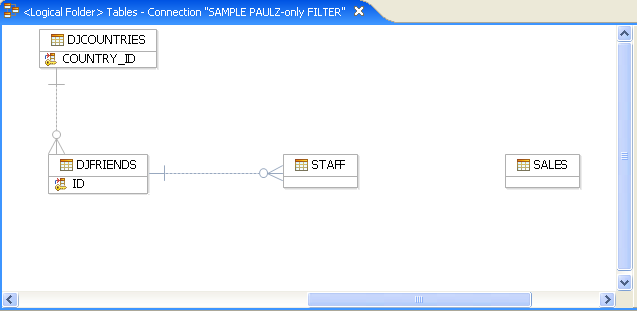
Note: Since you
selected the Infer implicit relationships option when creating this overview
diagram, you may see some relationships you didn’t expect. For our example,
highlight any relationships between the DJFRIENDS and STAFF table (by holding
your mouse button down and selecting the connecting lines), and delete them
using the Delete key. In addition, click and hold your mouse button,
select the STAFF and SALES tables and drag them to the right until
they are out of focus in your overview diagram. Your overview diagram should
look like this: