


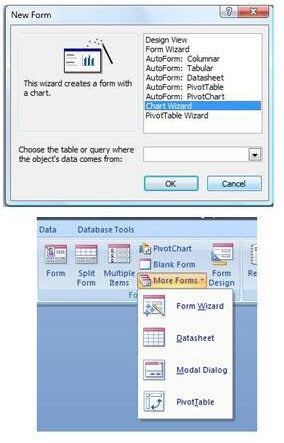
When I first started with Microsoft Access back in 1995, I focused on writing a data mining tool using Microsoft Graph. That tool of mine still sells today and it still works in almost the same way in Access 2007 as it did in Access 2. Now whilst I did my upgrade about a year and a half ago, I never actually developed any custom charts for clients. Therefore, it was surprising to me when a client asked me about charts that I found it was very hard to find out anything about this charting tool in Access 2007. I searched the Access Online Help for the words “chart” and “graph” all to no avail. I tried the Access form Wizard, which used to work in Access 2003 and there was no graphing option to be seen (see Figure 1). Eventually I found the chart wizard and I decided that this article would aim to provide the help you need to use the charting object in Access 2007.
|
|
| Figure 1 – Where has the Access 2007 chart Wizard gone? |
Graph buyer beware
Whilst I am an Access MVP and I have spoken to many of the good people in the Microsoft Access team, I am not privy to what controls and tools are going to be in future versions of Microsoft Access. The lack of help and minimal interfaces makes me wonder if this chart object is going to be around in the future. That said: anyone deploying an Access chart today can be pretty confident that this popular technology will be around for at least 1-2 versions and there definitely will be an upgrade path to a new and brighter chart object even if it goes. So with that in mind, let’s forge on.
The download database and searching for help
The download database (called charts2007.accdb) for this article has a very simple table that is suited to charting. Have a look at Figure 2 and you will see three text columns that are good for grouping and a date field that is good for trying out date consolidation. There are also two number fields, which we will use for the values in the graphs. Remember that this database uses VBA code so you will need to save the database into a trusted folder or trust the database after you open it.
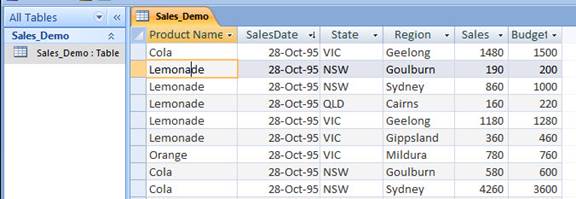
Figure 2 –the table that is used in the download database
Note: If you happen to research this topic further on the web, remember to use the term graph as well as the term chart. Microsoft Excel likes to use the word chart, Access used to call the chart object Microsoft Graph and importantly remember that both Excel and Access use the same graphing engine so look to Excel for inspiration.
Adding your first chart
To add a chart to your database, choose the Blank Form command in the Create ribbon menu (see right-hand side of Figure 1). Initially you will find yourself in the layout view of the blank form. Choose the Home ribbon menu and open the form in Design View. Now on the Design ribbon you will see a small Chart icon (shown in Figure 3). Click on the icon, go to your blank form and make a reasonably sized square by holding down the mouse button and then letting go. This then starts up the Chart Wizard as shown in Figure 4.
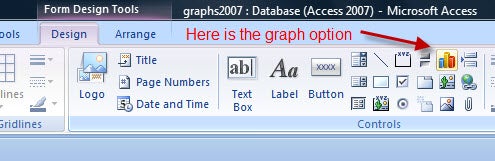
Figure 3 – The Chart icon on the Design ribbon in Access 2007
Choose Next and then add the fields that you want to consolidate by and the numerical fields that you want to display in your chart. In Figure 4, I am setting up a chart that will allow me to view product sales by date ranges.
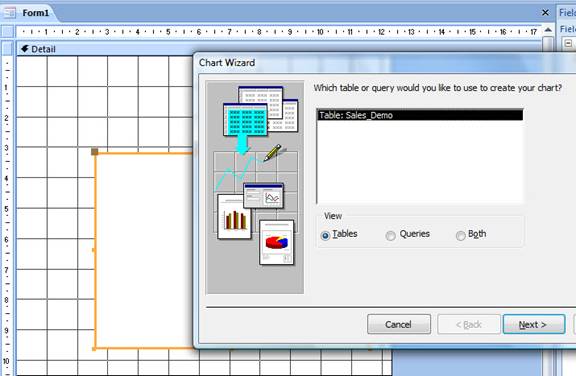
Figure 4 –Choose your columns
Choose Next and you will be given a large selection of charts to choose from (see Figure 5). If this is not bamboozling enough for you, there are many more that you can choose from later. For the time being, I suggest using a two-dimensional chart such as the bar chart except if you are charting your numbers into more than 15 columns. In that case, choose the line chart.
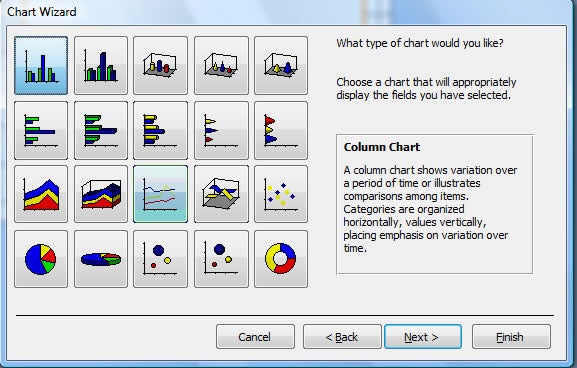
Figure 5 –The charts you can choose from in the Charting Wizard
Click Next to proceed to the next part of the charting Wizard. If you look at Figure 6, you will see how the chart is going to be arranged. Please note that on my Vista computer, the Chart does not appear unless I press the Back button and then move off the button before releasing my mouse. Weird but true. Anyway, you can vary the columns that you are going to chart in this part of the Wizard by dragging and dropping the columns from the right-hand side. Press Next, give your chart a title and press finish. Now find the Chart Object in the Properties Window and give it a name like MyChart. Save the form with a meaningful name as well.
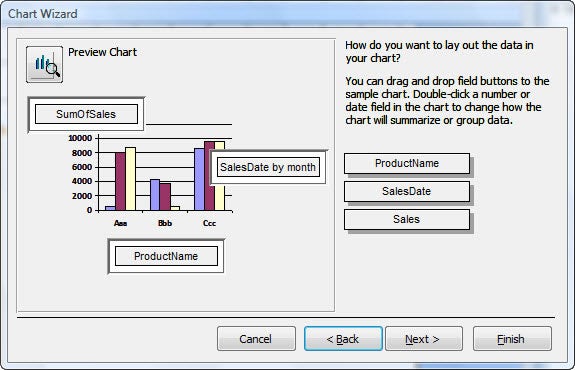
Figure 6 – The view of what is going to be displayed in the chart (pesky)
The next time you open the form you should see a chart that looks like Figure 7.
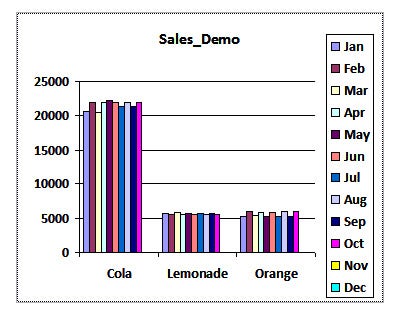
Figure 7 The first chart
A Vista Problem
Vista can cause a problem in that the Chart may not display straight away. What you will need to do in this case is open the form in design view and add the following VBA Code (where MyChart is the name of the Chart object).
Private Sub Form_Open(Cancel As Integer)
On Error Resume Next
  MyChart.Requery
End Sub
Getting the Query right
No matter what you do when running the Wizard, you will never get the query to do exactly what you want; so don’t bother running the Wizard again but instead change the design of the query in the Charts properties. To do this, open the form in design view, select the Chart object, choose properties, find the RowSource (as in Figure 8) and click on the build button.
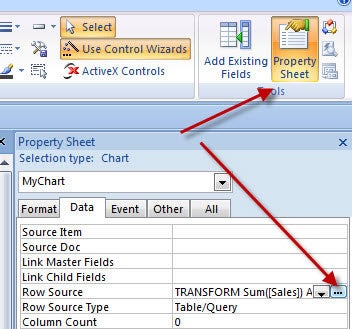
Figure 8 The RowSource of the Chart object
When you are in design view of the query, you may want to switch from the Cross Tab view to the Select view shown in Figure 9 to get a more traditional consolidation query. In my case, I changed the query to setup the data for a Bar/Line graph for each product by month. Here is the crosstab SQL that I created.
TRANSFORM Sum(Sales) AS SumOfSales
SELECT Format([SalesDate],"yy-mm") AS Months
FROM Sales_Demo
GROUP BY Format([SalesDate],"yy-mm")
PIVOT ProductName;
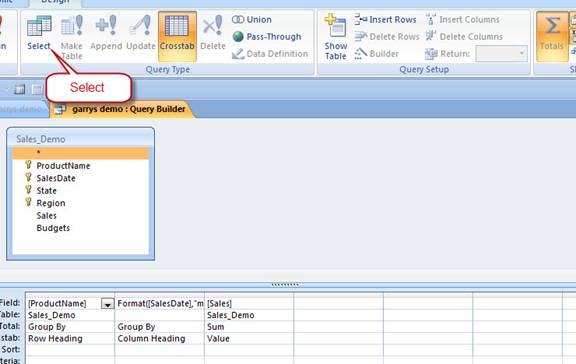
Figure 9 The Query Environment ~ watch your Crosstabs and Selects
Changing The Chart Object
Finally, I need to change the Chart Object into a Line chart. See Figure 10 to find out how to do this with the right click menu.
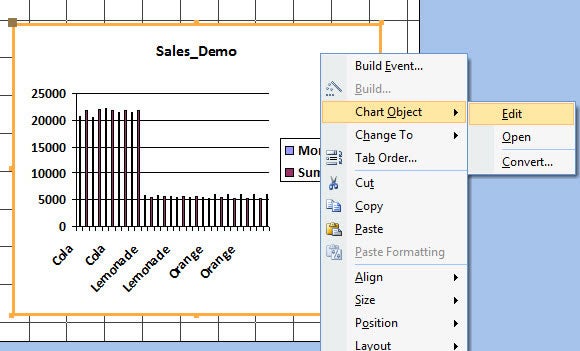
Figure 10 Getting into the design of the Chart Object
Having found your way into design mode of a chart, the trick to working on a chart design is RIGHT CLICKING. Lots of things can be changed in a chart if you pick them and Right Click to see what your options are. In Figure 11, I am about to change some of the layout and chart types for individual data series and the axis font sizes.
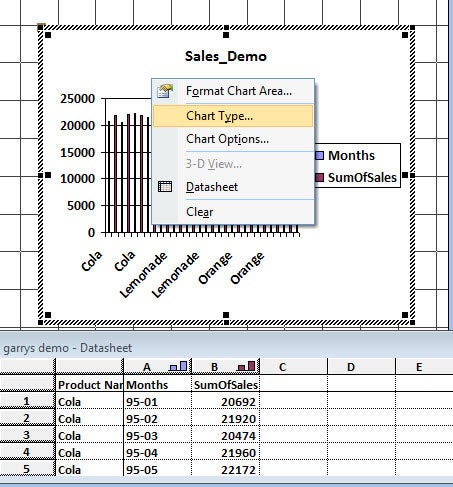
Figure 11 A chart object in design view, remember to Right Click
The End
Now I have created my Chart in Access 2007, check it out in Figure 12. I hope I have filled you in on the peculiarities behind Access chart and if you get frustrated setting up a chart, remember these rules.
- Access and Excel use the same charting object, so believe me Chart is powerful
- Access charts are driven by either Group By (Totals), select queries or Cross Tab queries
- The Chart Wizard will get you started but you will always have to go into design view to finish both the query and the chart design.
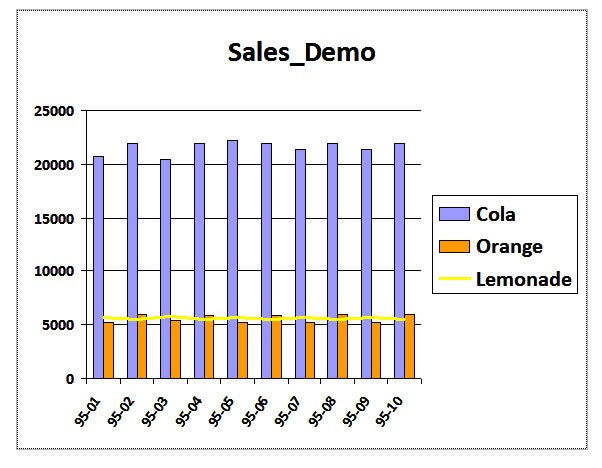
Figure 12 The form with the fancy chart that I created for this article.
Finally, even though I didn’t mention it, you can write really clever interactive graphical displays in Access forms by changing the SQL for the rowsource of the chart object with vba. I know this because the functionality behind my data mining tool, Graf-FX, uses this approach a “gazillion” times. Happy charting readers.
References:
Head to http://www.vb123.com/search and type either Graph or Chart.
No reference material at all was found in the Access 2007 help manual.
» See All Articles by Columnist Garry Robinson