


Learn how to deliver dynamic content by building a meaningful Business Intelligence Application, utilizing only what is available on the client’s desktop, when a Data Warehouse BI Application, SQL Server and SSIS/SSRS aren’t an option.
Introduction
Recently I was between major contracts and
was contacted by an agency that I have worked for before. They had a
department within a major retail bank that was having difficulties with a Microsoft
Access database, which had been created to allow the department to track the
results of customer satisfaction within the company. As I started life as an
Access developer and had a couple of months to spare before my next major
project was due to start. I agreed to look into their problems.
The database, although well written by an
internal resource. was quite rudimentary in its functionality and was only used
to store manual imports from excel and csv files on a monthly basis into
various data tables. Following the import, the user would then have to follow
a set of instructions to amend stored queries within the database to create
meaningful results, which could then be exported back to excel for the team to
format into graphs. Once exported the data was then used to manually create
graphs and tables that would be added to a dashboard, which was used to present
the data to the business. The problems, as described by the head of the
department, were the fact that the database was slow and required two to three
days of intensive work by a non-technical resource to input the data and then
create the reports, which had produced inconsistent data due to the “human
error” factor when amending the queries in the second step.
After viewing the database, I agreed to
hold a meeting with the major stakeholders to discuss their actual requirements
and provide guidance on what they may actually require. Following the meeting,
it was obvious that the department required the following:
- The ability to
store more than the 2 GB limit of MS Access to allow trends to be forecast from
stored data - Automated upload of delivered
files - Automated production of the
required reports including Dashboards and KPI’s - Automated delivery of the
resultant dashboards to the company
At the meeting, I discussed my
recommendations and suggested that this project would be an ideal scenario for
a Data Warehouse BI Application utilizing SQL Server and SSIS/SSRS to deliver
dynamic content to the department and interested parties using a Sharepoint
server. The head of the department discussed my recommendations with IT and
asked about the feasibility of a project to deliver the above; this however
proved unsuccessful as the company was going through a merge and IT was already
fully committed to upgrading the core delivery systems within the company. At
this point, the head of department discussed with me if I thought there was any
way I could assist. Following discussions with a colleague, who I had known
from a previous role when I worked within the IT area, it was established that
I could gain access to an instance of MS SQL server, which led me to believe
that I could help. Following further discussions, I embarked on delivering a
BI suite utilizing just those applications available on the standard desktop
along with access to a SQL Server instance.
Discussion
The main focus of this project was to move
the application from a rudimentary Microsoft Access Database to a fully-fledged
application using whatever applications and tools that were available within
the business area. Investigation of the desktop established that MS Office
2003 Professional was installed on the desktop of every user along with Adobe
Distiller 6.0. This, along with the availability of an instance of SQL Server
2005, led to the decision to convert the existing MS Access database to a Microsoft
Access Project connected to a SQL Server backend, which would then utilize VBA
and COM to automate all those manual processes including creation and delivery of
the Dashboard. Utilizing a clean MS Access Project, I connected to an instance
of SQL Server 2005 on the companies’ development box and proceeded to convert
the import routines from the old database into data loads and error checking
routines, using vba and SQL Server stored procedures to check the data on
load. Due to the requirement of no table creation imposed on the company SQL Server,
it was necessary to build permanent load tables to load the data in from the
ADP.
To enable grouped and summed data to be
used with the output of the ADP, I adapted a dynamic pivot routine that I have
used before within SQL Server 2005 – I have included an example below – this
provides very similar functionality to the Cross Tab Query within MS Access.
-- =============================================
-- Author:        Peter Evans
-- Author:        Peter Evans
-- Create date: 12 Jan 2008,
-- Description:   This procedure provides a list of all
-- percent to target scores by division and month
-- for Dashboard creation.  It is called from the Front end which is a Access
-- 2002 Front end.  Procedure is called using VBA calls.
-- parameters passed in are a non comma sep list of months for
-- year one and year two and both year dates as integer along
-- with channel identifier and concpet identifier
-- data is returned from the View DBoardConceptScore which has a
-- derived field MonthId which provides a sort capability for the
-- pivot table created and also an identifer of month in varchar format
-- =============================================

ALTER PROCEDURE [dbo].[T100output_DBoardConceptPercData]
      -- Add the parameters for the stored procedure here
@intChanId smallint, @strRMth1 nvarchar(2000), @intYear1 smallint,
@strRMth2 nvarchar(2000), @intYear2 smallint, @intConcept smallint

AS
BEGIN

DECLARE @colsY2 NVARCHAR(MAX)
SELECT  @colsY2 = STUFF(( SELECT DISTINCT TOP 100 PERCENT
                                '],['+ Cast(t2.MonthId as Varchar(9))
                        FROM    CalendarView AS t2 INNER JOIN
dbo.iter_intlist_to_tbl(@strRMth1) AS i ON t2.Month = i.number      WHERE Year = @intYear1
ORDER BY '],['+ Cast(t2.MonthId as varchar(9))
                        FOR XML PATH('')
                      ), 1, 2, '') + '],'

SELECT @colsY2 = @colsY2 + STUFF(( SELECT DISTINCT TOP 100 PERCENT
                                '],['+ Cast(t2.MonthId as Varchar(9))
                        FROM    CalendarView AS t2 INNER JOIN
dbo.iter_intlist_to_tbl(@strRMth2) AS i ON t2.Month = i.number WHERE Year = @intYear2
ORDER BY '],['+ Cast(t2.MonthId as varchar(9))
                        FOR XML PATH('')
                      ), 1, 2, '') + ']'

DECLARE @cols2 NVARCHAR(MAX)
SELECT  @cols2 = STUFF(( SELECT DISTINCT TOP 100 PERCENT
'],pvt.['+ Cast(t2.Monthid as Varchar(9))
                        FROM    CalendarView AS t2 INNER JOIN
dbo.iter_intlist_to_tbl(@strRMth1) AS i ON t2.Month = i.number
                        WHERE Year = @intYear1
ORDER BY '],pvt.['+ Cast(t2.MonthId as Varchar(9))
                        FOR XML PATH('')
                      ), 1, 2, '') + '],'


SELECT @cols2 = @cols2 + STUFF(( SELECT DISTINCT TOP 100 PERCENT
'],pvt.['+ Cast(t2.Monthid as Varchar(9))
                        FROM    CalendarView AS t2 INNER JOIN
dbo.iter_intlist_to_tbl(@strRMth2) AS i ON t2.Month = i.number
                        WHERE Year = @intYear2
ORDER BY '],pvt.['+ Cast(t2.MonthId as Varchar(9))
                        FOR XML PATH('')
                      ), 1, 2, '') + ']'


DECLARE @query NVARCHAR(MAX)
SET @query = N'
SELECT pvt.Title,' + @cols2 +'
FROM  (SELECT  t2.Title, t2.MonthId, t2.Concept, t2.PercScore
FROM DBoardConceptScores AS t2
WHERE t2.Concept = ' + cast(@intConcept as varchar (2)) + '
AND t2.ChanFk =' + cast(@intChanId as varchar(1)) + ')p
PIVOT (Sum([percscore]) FOR [Monthid] IN (' + @colsY2 + ')) AS pvt
ORDER BY pvt.Title'

EXEC (@query)

END
Once the data had been imported and saved
correctly, it was then down to the matter of delivering the reports. Allowing the
users to select using a form from the ADP and then using a module within vba to
call a stored procedure to create the data required for the reports removed the
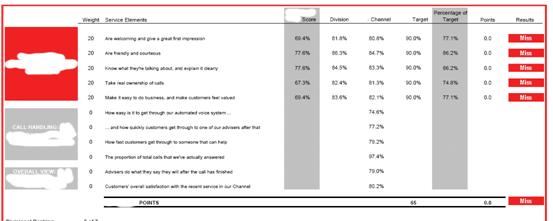
“human error” side of the equation. Once selected, the reports run in the
background, creating an excel version of each report chosen, utilizing vba com
calls to open excel on the clients machine, call an existing template and
populate the data using ado recordsets based on stored procedures . These
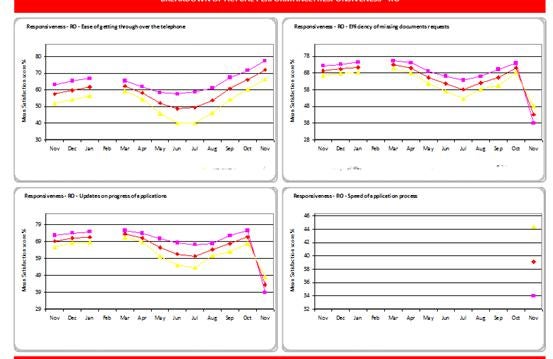
reports included monthly average data and results against targets, summary data
based on yearly and quarterly stored and dynamically created data and the
monthly dashboard, which gave an overview of the companies’ performance against
not only targets but also their competition, but utilized automatically
produced charts instead of figures.
After the excel reports had been verified
by the team they then required the ability to create pdf versions of the
documents to be automatically emailed to branches, divisions and regions. This
was achieved using pdf distiller, which had been installed on the user’s
machines as standard. The emailing of the reports was achieved by leveraging
the COM component of MS Access to talk to an SMTP server to create the mail
item and attach the required reports and then despatch. The SMTP server was utilized
to avoid the recent updates to MS Outlook security, which would have required a
special script to have been written for the users despatching the mail to
prevent the annoying pop up of the security warning, which would have appeared
for each report (at the lowest level this would be over 700). To achieve a
‘sent’ item in the departments mail box, a copy was sent to the department
group mail box and a rule run on the incoming folder to transfer mails with a
certain subject line into the sent folder of the mailbox. Along with the
produced reports and graphs, the users were also given the ability to generate
reports as Excel files to allow further investigatory work to be completed.
Conclusion
It is possible with a little creativity and
a lot of hard work to provide a form of Business Intelligence to the broader
community without utilizing a Data Warehouse or any of the normal tools associated
with either MOLAP or ROLAP storage. Using a mix of standard desktop
applications and available storage mediums, a pseudo warehouse has been created
which is accessed with SQL stored procedures controlled from the desktop. It
is appreciated that this application is narrowly focused on one area of business
intelligence delivery but is hoped that the ability to export slices of the
stored data tables into MS Excel will allow the department to deliver extended
reports based upon the Dashboard and KPI’s created. This application has
already been up and running within the company for nearly two years and has had
a major impact on how the company deals with its customers.
Deliverables included:
- Automated upload
of excel and cvs delivered data – including data checks for consistency and
completeness of the file being uploaded. - Conversion of MS
Access queries and modules to MS SQL Server 2005 stored procedures and
functions. - Automated
population of stored summarized data tables. - Leverage of MS
Access COM and MS Excel COM abilities to create automated dashboard production
on a monthly basis utilizing 15 individual metrics. - Leverage of MS
Access COM and MS Outlook COM abilities to create automated monthly
distribution including dynamically updateable details to each group of emails.