


Introduction
Profiler is a tool that monitors the events and activity running on a SQL Server. Using profiler, this monitoring can be viewed, saved, and replayed. The results can be saved to a file or inside a SQL Server table. Some of the tasks Profiler can be used to perform include stress testing a server, analyzing performance, debugging TSQ statements, and auditing SQL Server activity. The tool is free and bundled with the SQL Server installation. This article will focus on using Profiler with SQL Server 2005, but the tool is also included with SQL Server 2000 and SQL Server 2008.
Trace
SQL Server Profiler is really a graphical interface to create what’s called a Trace file. These Trace files can capture which statements are currently running on SQL Server, how long they are taking, the type of locks being used, and any errors being thrown. Creating a Trace can be done without using Profiler, but because the Profiler interface is flexible and simple to use, it’s the ideal tool to start with.
Profiler
In this first example, we’ll use Profiler to view the TSQL statements running on the SQL Server. To start Profiler, go to Start, Programs, Microsoft SQL Server 2005, Performance Tools, and then select SQL Server Profiler. A blank Profiler screen should appear. From the top menu, select File, then New Trace. A “Connect to Server” dialog box will be displayed. Connect into the server. The “Trace Properties” screen will appear as shown below:
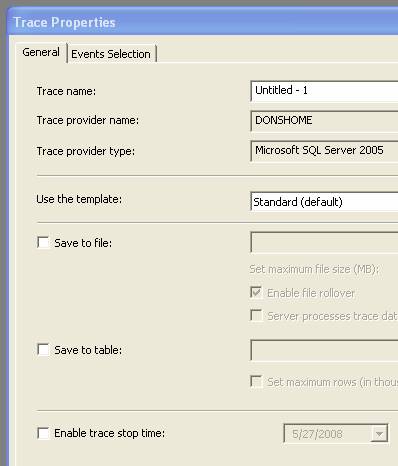
Let’s give this first trace a name of “Test1”. Keep the “Use the Template” default of Standard and click Run. A query result window will open. I previously had opened the SQL Server Management Studio and will now execute the statement “SELECT *FROM Person.Address” , the results are shown below:
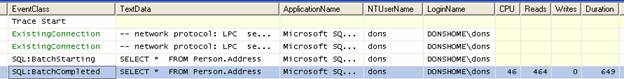
The first line just notes the beginning of the Trace. The next two lines show my SQL Server Management Studio connection. Next, we see the SELECT statement beginning followed by it completing. Notice the entire TSQL Statement has been captured along with amount of CPU, Reads, and Duration it took to complete. To stop the Trace, click the Red square on the top menu. The amount of rows that can be collected using the Standard template can often get very voluminous making it difficult to zero in on the data You’re after. To make the results more manageable, events and columns can be filtered out. This is done through the trace properties by selecting File, Properties from the top menu, then clicking the “Events Selection” tab as shown below:
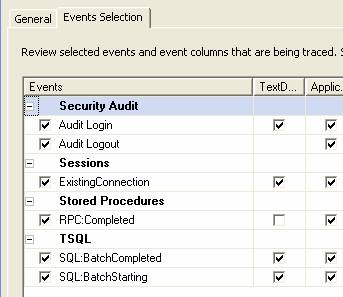
Listed above are the various events that can be monitored. To add and remove columns click the “Column Filters” button. Columns can be filtered by many criteria types including Login Names, Duration times, and the TSQL Statement issued.
To save the results, click File from the top menu, and then “Save as Trace File”. In addition to saving as a file, trace results can be saved to a table. This is a handy solution when quires need to run against the results. For example, a query could be executed to look for the most CPU intensive statements. Close this Profiler window by select File and then Close from the top menu.
Longest Running Query Example
In this example, we’ll create a Profiler that will show the longest running statements on the SQL Server. From the top menu, select File, New Trace. A “Connect to Server” dialog box should open. After connection to your server, give the trace a name, then select “TSQL_Duration” as the template.
Templates are saved files that contain the events, columns, and other confirmation options that can be used to start a trace. By default, SQL Server Profiler comes with eight preconfigured templates: SP_Counts, Standard, TSQL, TSQL_Duration, TSQL_Grouped, TSQL_Replay, TSQL_SPs, and Tuning. In addition to these preconfigured templates, you can create and save your own templates by selecting File, Save as Template, from the main menu once you have started a trace.
For this example, we’ll save the Trace results to a file. Check the box “Save to File”, browse to a destination folder. Looking at the “Events Selection” tab will display the events to be monitored. Because this Template is designed to look for long running queries, only TSQL statements and stored procedures have been selected. Even though we’re starting with a template, you can still add and remove events and columns by clicking “Show all Events” and the “Show All Columns” from the left side of the page. Click run to start the trace.
After running a couple of test queries against the Adventure Works database, stop the trace by clicking the red square. To open the trace file just created, from Profiler, select File, Open, Trace File, and browse to your saved file (it will have a TRC file extension). A section of my trace results are shown below.
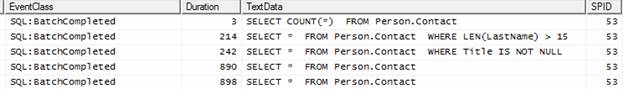
The Event Class is events profiler can monitor, such as a Login, Logout, Locks being acquired, or a query batch completing. The Duration listed is in milliseconds. The TextData is the actual statement that was executed. From the results above, we can see that SELECTING * FROM Person.Contact was the longest running query.
Profiler can generate very large amounts of data. If you’re looking for something specific, try and set the template events and columns to only those needed. For example, running the same test as above, but using the Standard Template rather than TSQL_Duration Template will produce at least twice the rows returned because a record will be written at the start of each query as well as at the end. In addition, each database login and logout will add additional rows.
Conclusion
Profiler is an extremely useful tool for monitoring and troubleshooting SQL Server. The tool is free and bundled with SQL Server 2000, 2005, and 2008. Profiler can also be linked to the Windows Performance Monitor. Next month we’ll look at addition features, such as scripting Profiler jobs to run on an automated schedule.