


Introduction
Profiler is tool that monitors the events and activity running on a SQL Server. Using profiler, this monitoring can be viewed, saved, and replayed. The results can be saved to a file or inside a SQL Server table. Some of the tasks Profiler can be used to perform include stress testing a server, analyzing performance, debugging TSQ statements, and auditing SQL Server activity. The tool is free and bundled with the SQL Server installation. In Part 1 of this series, we explained the difference between a Trace and Profiler as well as creating a couple of test traces utilizing the Standard and Duration preconfigured templates. To begin this article, we’ll examine the additional preconfigured templates and then move on to synchronizing Profiler and Perfmon together, followed by running Profiler as a scheduled task.
Preconfigured Templates
SQL 2005 Profiler ships with eight built in preconfigured templates. To view them, start Profiler by going to Windows Program Files, MS SQL Server 2005, Performance Tools, and then selecting SQL Server Profiler. The middle section includes a drop down labeled “Use the template”. Selecting it shows the eight preconfigured templates SP Counts, Standard, TSQL, TSQL Duration, TSQL Grouped, TSQL Replay, TSQL SPs, and Tuning. The first template, SP Counts, will capture all of the stored procedure names run along with the number of times they have been executed. The Standard template used in the first article is the “Swiss army knife” of captures. It collects a voluminous amount of data including information about all connections, TSQL batches, stored procedures, login, logout, and batch starting stopping statuses. The Standard template is the default starting point for new traces. The next template is called TSQL. It captures all of the statements issued against a server along with Audit, Connection, and Batch statuses. The template TSQL Duration collects the statements executed against SQL Server along with their durations. The durations can be used to quickly identify slow running queries. The next template, TSQL Grouped, is similar to the TSQL template in that it captures all of the statements executed, but it also captures the user or client application that issued the command. The template TSQL Replay can be used for creating benchmarks or testing traces, it capturers Cursor, RPC, and batch statuses. The template TSQL SP is next in the list and captures Stored Procedure information including Auditing, Connection, and Batch status. The final template, Tuning, collects information about statements that have been issued for tuning purposes.
Performance and Profiles
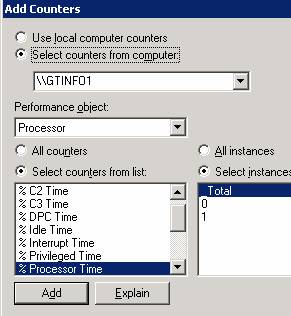
An interesting feature of Profiler is the ability to integrate Perfmon (Windows Performance Monitoring tool) data into a captured Profiler session. This allows statistics such as CPU, hard disk, and memory usage to be visually displayed and stepped through along with Profiler data in sync. To create an example of this, open SQL Server Profiler, and select File, New Trace. Specify your server and connect. Keep the default template of Standard and click Run. Next, open Perfmon by going to Start, run, Perfmon. Expand the “Performance Logs and Alerts” group, and then right click on “Counter Logs”. Select “New Log Settings” and supply a name. Note the first line stating where the file will be located. Click the “Add Counters” button and then select the Performance Object “Processor”, highlight “% Processor Time” as shown below. Click Add.
Change the Performance Object drop down to Physical Disk, and then select “% Disk Time”. Click Add and then Close, and OK. Now that both Performance Monitor and Profiler are running, open the SQL Server Management Studio. Create some test activity by using the script below.
lUSE AdventureWorks;
GO
DECLARE @Count int;
SET @Count = 0
WHILE( @Count < 50)
 BEGIN
  SELECT *
  FROM Sales.Store
  SELECT *
  FROM Person.Address
  SET @Count = @Count + 1
 END
Once the script is done, close the Management Studio. From the Perfmon tool, expand the “Performance Logs and Alerts” group, click on Counter Logs, click your test log, then push the square button on the top menu to stop the log. Close Perfmon. Returning to SQL Server Profiler, click the red button on the top menu to stop the trace. Select File, Save As, and then Trace File, provide a name and save. Now open the saved trace file by selecting File, Open, Trace File and selecting your TRC file. With the trace file loaded, (we can only combine Perfmon data with saved trace files, not live trace data), Select File, Import Performance Data, and browse to your saved performance file. Next, a dialog box will appear presenting the counters you logged. Click the check boxes to include them into the Profiler then click OK. You’ll now be presented with a four-pane display. The top shows events captured by Profiler. The next window shows the Perfmon graph as shown below.
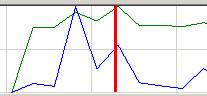
Beneath this window, the Perfmon counter labels are displayed. Finally, the SQL statements executed at the display time are shown. All four windows are in sync with each other. So clicking anywhere in the Top Profiler or Perfmon window will move all four displays.
Running a Trace as a Job
It may be helpful to run a trace periodically through the day. This would allow you to gather data at fixed times to develop a baseline of performance statistics. A simple way to achieve this is to copy a Trace Template into a SQL Server Agent Job. To begin, open SQL Server profiler and create a new trace using the standard template. Check the box “Save to File” and provide a location. Next check the box “Enable Trace Stop Time” (leave the default time). Click Run. Stop the Trace, from the top menu select File, Export, Script Trace Definition, for SQL Server 2005, and provide a file name. Close Profiler. From the Windows File Explorer, navigate to your saved Trace Definition; it will have an sql file extension. Double click it so the code is presented inside the SQL Server Management Studio. There are two variables in red that need to be changed, @DateTime and InsertFileNameHere. The first, @DateTime, is the the time the trace should stop. For this example, we’ll let the trace run two minutes by change the value of @DateTime to “set @DateTime = DATEADD(mi, 2, GETDATE())”. Next change the file name to something like this “ N’c:\temp\mytrace’ “. Notice you don’t need the trc extension, it will be auto filled in. Copy the entire sql file to the clip board. The last step is to create an SQL Agent Job. From SQL Server Management Studio, expand the SQL Server Agent, and then right click on Jobs, and select New Job. Give the Job a name then click Steps on the left. Select “New” from the bottom and call this step “Delete old File”. The purpose of this step is to delete any files with the same name you filled in for the InsertFileNameHere. Change the “Type” to CmdExec and for the text put the DOS command “del c:\temp\mytrace.trc” (or whatever your InsertFileNameHere path info is). Click OK. At the bottom click New. Give the step a name and leave “T-SQL” as the type. Paste the entire Trace Defination into the command box. Now a schedule, alert, and notifications like any other standard Agent job can be set.
Profiler can be a very invasive tool. Care must be taken that production servers don’t bog down or slow due to traces being captured. Saving traces to a table rather than a file, and running Profiler from the GUI can both draw heavy resources. Looking at the SQL Agent job created above, a number of system stored procedures are called, such as sp_trace_create and sp_trace_setevent. Using these as TSQL Statements can sometimes be more efficient than the Profiler GUI. Check BOL (Books On Line) for additional details. The search topic will be “SQL Trace, about SQL Trace”.
Conclusion
Profiler is a free, bundeled tool for monitoring and diagnosing SQL Server performance. After a few test traces, Profiler will become eaiser to use. Combining Profiler traces along with Performance logs can provide interesting insight about resource usage.