Introduction
While doing performance troubleshooting, have you ever wished for a process that was easier and faster to follow, especially when your system had slowed down and business is being impacted? Did you wish you could compare the execution plans for a query from a different time frame easily and quickly? Did you wish you could regress the query plan easily and quickly instead of going through a lengthy process of using a plan guide to do that? Did you wish execution plans for the queries didn’t get lost even after a server restart or upgrade? If your answers to the above questions are yes, you will be happy to know that the SQL Server 2016 Query Store feature greatly simplifies performance troubleshooting, helps you in the scenarios mentioned above and many more. In this article series, I am going to talk about this new feature and how it greatly simplifies the performance troubleshooting process.
Query Store – What Is It and What are Its Advantages
Query Store is a new feature in SQL Server 2016 which, once enabled, automatically captures and retains a history of queries, query execution plans, and runtime execution statistics for your troubleshooting performance problems caused by query plan changes. This new feature greatly simplifies performance troubleshooting by helping you quickly find performance differences, even after a server restart or upgrade.
If you are a DBA or if you have been doing performance troubleshooting, you will love this newly introduced Query Store feature in SQL Server 2016. Once enabled, Query Store works like a flight data recorder on your SQL Server database (it also works in Azure SQL Database V12) and automatically captures a history of queries executed, execution plans used, query runtime execution statistics, and retains these for your troubleshooting performance problems caused by query plan changes.
This new feature helps you get insights on query & overall performance of a database and greatly simplifies performance troubleshooting by helping you quickly find performance differences, even after a server restart or upgrade as it persists this information inside internal tables of the database.
As part of the regression, it allows you to enforce policies to direct the query engine compile queries and executes in a specific manner (you can specify to choose a specific execution plan to use rather than the default one), something that you have been doing with force plans earlier.
As a DBA, you might have been doing performance troubleshooting for years now, even with the earlier versions of SQL Server, but what makes Query Store a great feature is:
- It is integrated in SQL Server engine itself, which automatically starts capturing information (queries executed, execution plans used, query runtime statistics aggregated over interval) asynchronously (having a very minimal impact) once enabled.
- It persists the captured information in internal tables inside the database for later use; this means you can get this information even after a server restart (unlike during regular operation where a plan cache is stored in memory only and is lost after server restart).
- You can enable this feature for a specific database for which you want to do performance troubleshooting.
- It includes several Dynamic Management Views (DMVs) to access captured information as well as it has pre-built reports for quickly analyzing captured information.
Having said that, Query Store makes performance troubleshooting easier and faster, letting you save time and making your work easier so that:
- You can quickly pinpoint the most expensive queries (in terms of CPU, memory, I/O etc.)
- You can get full history of query execution
- You can get all queries that regressed (a new execution plan was generated by query engine, which is not as efficient as the older one)
- You can easily force a better plan from history with a single line of T-SQL if you find a query was regressed
- You can safely do a server restart or upgrade without losing captured information, as they are stored as part of the database in internal tables
Query Store – When to Use It
These are some of the common scenarios where you can leverage the Query Store feature:
- To understand what kind of workloads your customers or users are actually using – it captures query text as well as the query execution plan
- To identify top n queries (by query execution time, memory consumption, I/O etc.) in the past n hours; identify queries that have a high runtime variance by doing comparison over time
- To determine the number of times a query was executed in a given time frame; to determine queries that have changed plans since yesterday (or since some specific point in time)
- To analyze the resources (CPU, I/O, and Memory) utilization for the database for which this feature has been enabled
- To audit the history of query plans for a given specific query; audit the cost of the queries so that you can ensure performance SLA (Service Level Agreement) or to evaluate capacity needs of an application and to identify resource contention
- To quickly find and fix a plan performance regression by forcing the previous query plan, (which you believe, was performing better then a newly generated plan). You can also fix queries that have recently regressed in performance due to execution plan changes after recent upgrades or any other changes.
Query Store – What Gets Captured and How is It Retrieved
Once enabled for a database, Query Store starts capturing query texts executed against that database (including semantic-affecting context settings, parametrization type, containing object: stored procedures, table valued functions, triggers, etc.), execution plans generated during compilation and query execution statistics captured during actual query execution. Query Execution or Runtime Statistics are aggregated per unit of time or interval and default is an hour; these statistics include
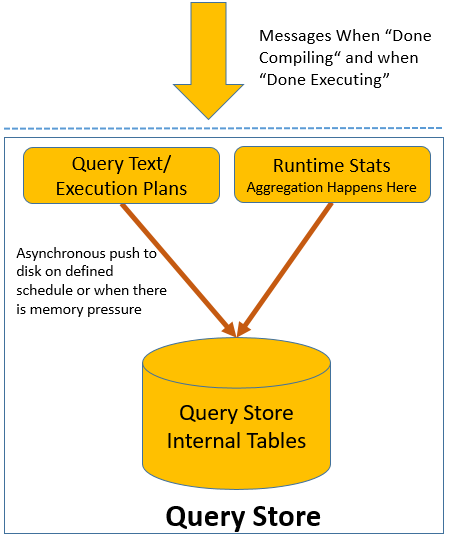
When SQL Server does compilation of a query, it captures the query text and query execution plan and saves it in-memory first (so that IOPS can be minimized). Likewise, after execution of each query it captures runtime execution statistics, aggregates it and again saves it in-memory. Eventually, in-memory data gets flushed to disk either on a defined schedule or when there is memory pressure:
Figure 1 – Data write to Query Store
Query Store does aggregation of the information according to the time granularity you have specified (default is one hour); the aggregation will be done in memory and then based on the database option DATA_FLUSH_INTERNAL_SECONDS, aggregated data will be stored on disk by a background process asynchronously very much like how checkpoint works. When there is memory pressure on the server, some of the data from memory will be flushed to the disk in order to release the memory for others.
Query Store separates data by time windows, allowing you to see database usage patterns and understand when query plan changes happened on the server.
Figure 2 – Data Aggregation on interval
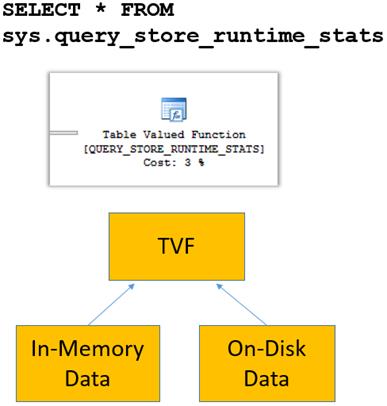
When you query data from Query Story using DMVs or Table Valued Functions, it merges data from memory and disk transparently (does outer join so that you get up-to-date information) to provide you complete details. For example, as you can see in the figure below, sys.query_store_runtime_stats table valued function merges in-memory and on-disk data so that you get a consolidated view when you query from it.
Figure 3 – Data Read from Query Store
Note: The feature mentioned and demonstrated in this article is based on SQL Server 2016 Release Candidate and might change when RTM is available or in future releases.
Conclusion
Query Store is a new feature in SQL Server 2016, which once enabled automatically captures a history of queries, execution plans, runtime statistics, and retains these for your troubleshooting performance problems caused by query plan changes. This new feature greatly simplifies performance troubleshooting by helping you quickly find performance differences, even after a server restart or upgrade. In this article of the series, I talked about this new feature and its advantages, then explained some of the scenarios where you can use it and finally I talked about data capture processing, including what gets captured, and how it is retrieved. In the next article of the series, I am going to explain query execution flow when using Query Store and how it differs from regular query execution flow, its architecture and how to get started with it.


