


By Angela Cataldo
The Past and Its Problems
Extended Events we–have all heard about it, but did you ever troubleshoot SQL Server 2008 performance, locking and connectivity issues using this source of data?
I expect the answer to this is:
“I tried but couldn’t get the information I needed easily”
Using Extended Events in SQL Server 2008 meant having to write complex T-SQL statements to gather the data needed, which was then returned as XML. As such, this method was not always the first choice of the Database Administrator (DBA) when looking for a quick way to access data.
The Here and Now and the Solution
SQL Server 2012 has given DBAs the solution for capturing Extended Event data in an easy to use GUI component, built into SQL Server Management Studio (SSMS).
Extended Event sessions are the new DBA Power Tool for gathering data in an intuitive and simple way. They require a smaller footprint to trace SQL Server Instance information and with the introduction of a GUI for configuration, should be the first choice for a DBA.
How to Create an Extended Events Session
In this example I am going to demonstrate how to:
1. Create an Extended Events session to monitor deadlocks
2. Filter the data captured by the session
3. Specify session data storage
4. View extended properties of the session
5. Watch live data for a simple deadlock scenario
Classic ways of viewing deadlock information in previous versions of SQL Server include:
- Capturing data in the SQL Server Error logs by enabling Trace Flags 1222 and 1204
- Running a trace in SQL Server Profiler
Step 1
Open SSMS and drill down to the Management folder, Extended Events and Sessions in Object Explorer.
Dependent on the version of SQL Server 2012 there are two default sessions:
- AlwaysOn_health – this is disabled by default
- system_health – this is running by default and gathers system data that can help you troubleshoot performance issues.
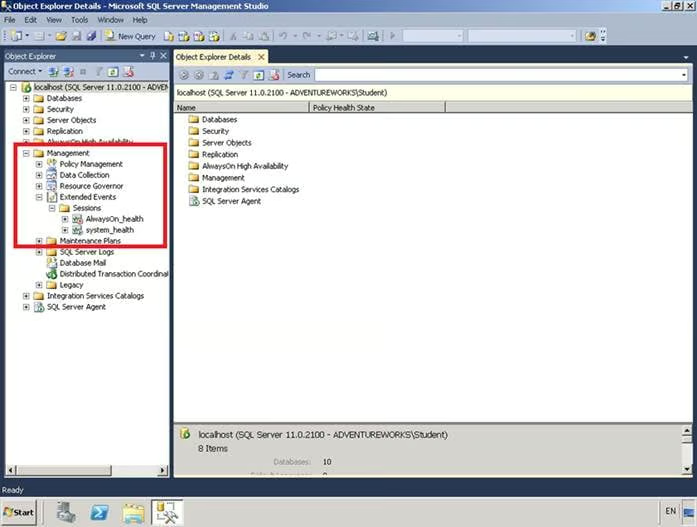
SSMS Management folder, Extended Events and Sessions
For the purpose of this demonstration I will be creating a new session and stepping through the new session wizard.
Step 2
Right click on the Sessions folder and either select New Session Wizard or New Session.
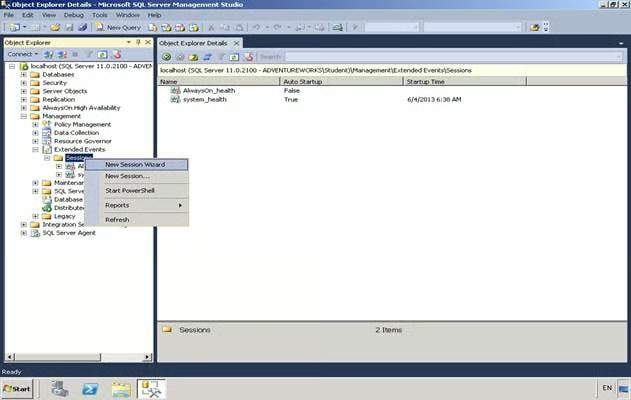
New Session Wizard
We will skip the Introduction page on the setup.
The next step is to enter a name for the session and specify start-up. For the purpose of this demonstration I have named the session Deadlock_Monitor and opted not to schedule the session to start at server startup.
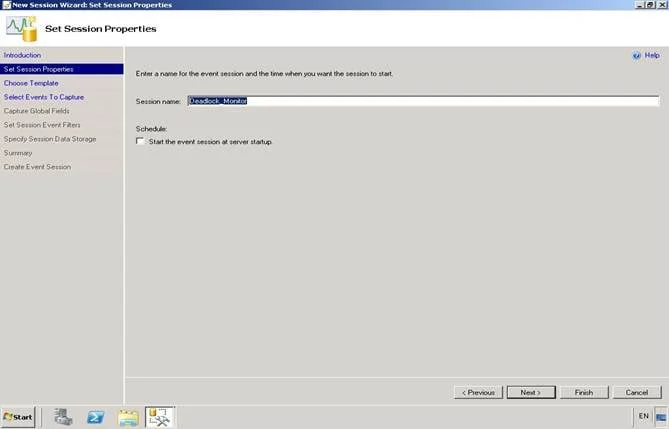
Set Session Properties
Step 3
There are a number of Templates to help us get started with using Extended Events to sample or track data. These templates can be modified adding additional events to capture and global fields to report data.
For the purpose of this demonstration I will not be using a template and selected the Do Not Use Template radio button, then click Next >
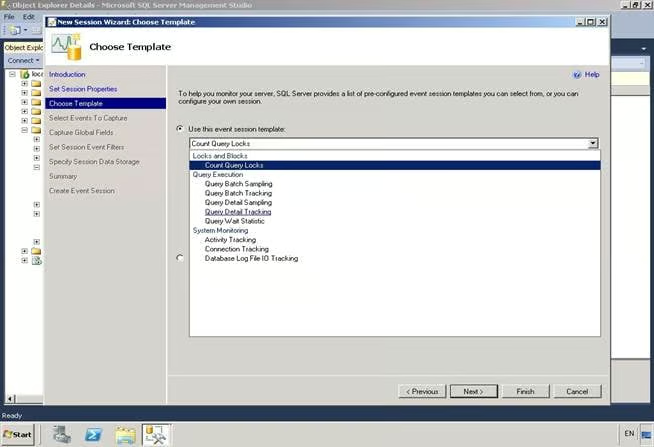
Extended Event Tenmplate
Step 4
When selecting Events to Capture, things are made easy with good sorting capabilities by Category, Channel or searching for events in Event Library.
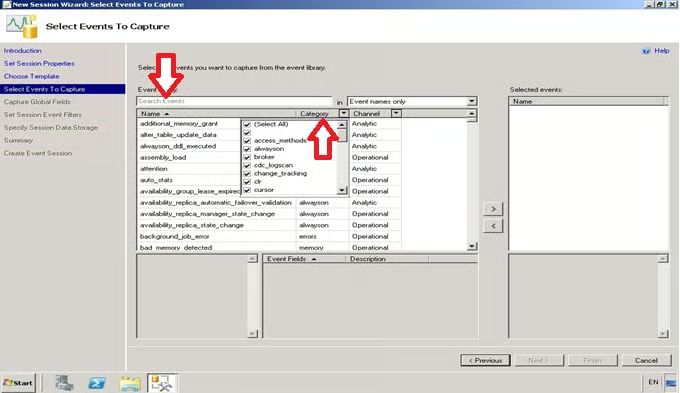
Search Events
I have opted to capture events for the Category deadlock monitor and a few added extras to enhance the data collected for monitoring deadlocks by searching the Event library for the word “lock”.
To add an event to the session, select the event in the Event library grid, click on the right arrow to add it to the Selected events grid on the right. Once all events are selected click Next >
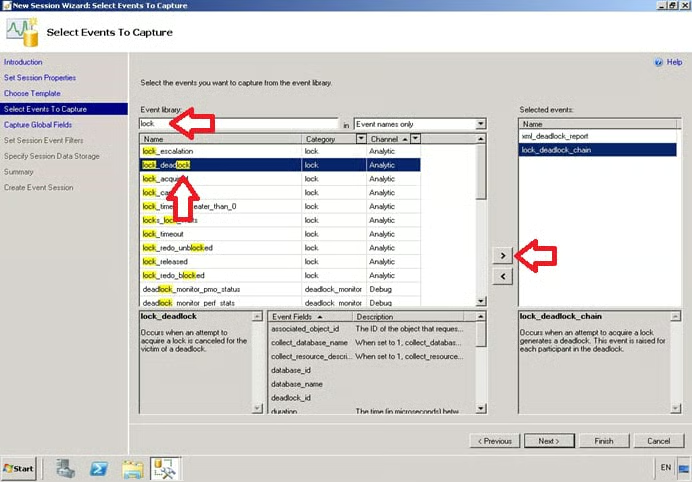
Select Events to Capture
The events included in my example are:
- xml_deadlock_report
- lock_deadlock_chain
- lock_deadlock
Now you might say:
“Why don’t I just add the extra events into the system_health default session as the xml_deadlock_report is already captured in this?”
And yes you could do this but as an organisation you may need to monitor deadlocks specifically and have a more focused session capture of data.
You can remove the xml_deadlock_report from the system_health session as this is customizable.
When adding events to any session you need to keep in mind that the process of tracking events comes at a cost, those events that are particularly costly to capture come with a warning within their description so be sure to watch out for these.
Step 5
Each event that you select has its own collection of fields that can be enhanced by adding Global Fields, which are actions captured for all events in the session.
Select the Name of the fields you require and click Next >
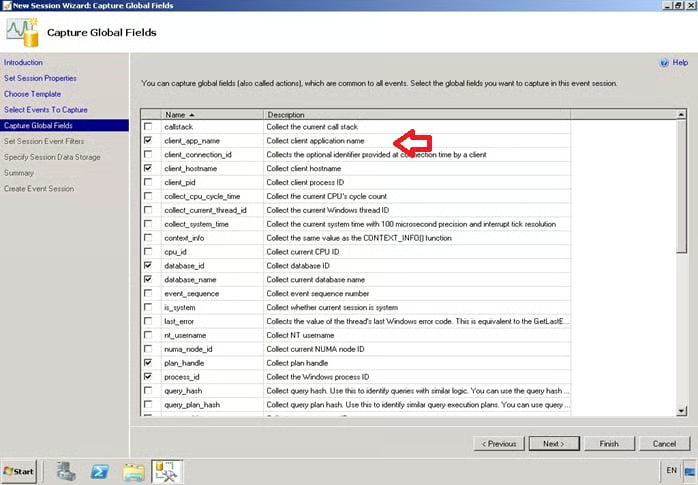
Capture Global Fields
I have opted for the following fields:
- client_app_name
- client_hostname
- database_id
- database_name
- plan_handle
- process_id
Step 6
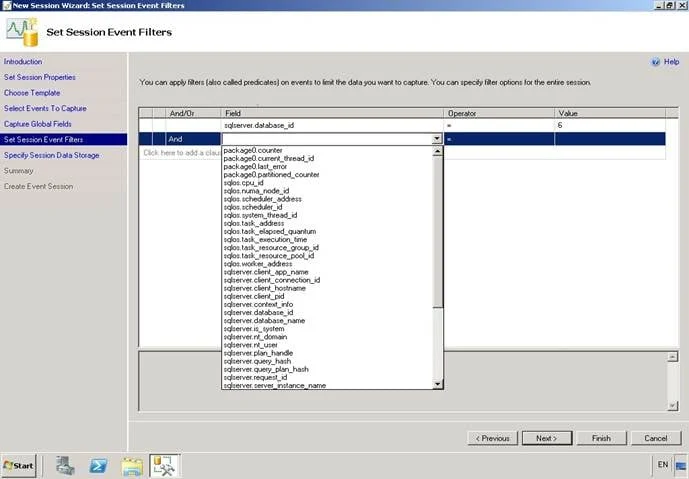
The next step is to consider limiting the amount of data that is retuned by adding Session Event Filters.
To create a filter you specify a Field, Operator and Value. The events retuned must match the criteria you set.
I have only added one filter for sqlserver.database_id Field for the Value that is equal-to (=) 6, which is the Internet Sales Database.
I could create more filters adding And/Or clauses building up a more complex Event Filter utilizing more of the available Operators.
Once you have created all the Event Filters you require, click Next >
Set Session Event Filters
Step 7
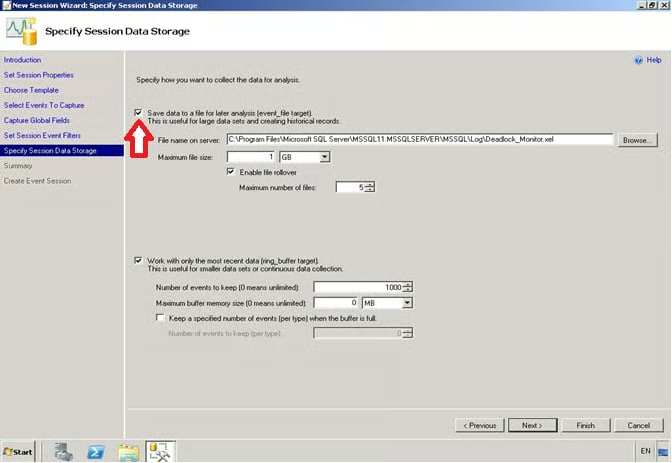
The final step in configuring your Extended Event Session is to configure Session Data Storage.
For large data sets and historical records set Save data to file for later analysis, enabling a maximum file size and file rollover.
To work with the most recent data and for small data sets use the second option, saving data to a ring_buffer target, enabling Number of events to keep and Maximum buffer memory size.
Specify Session Data Storage
For this demonstration I selected to Save data to a file for later analysis; click Next >
Step 8
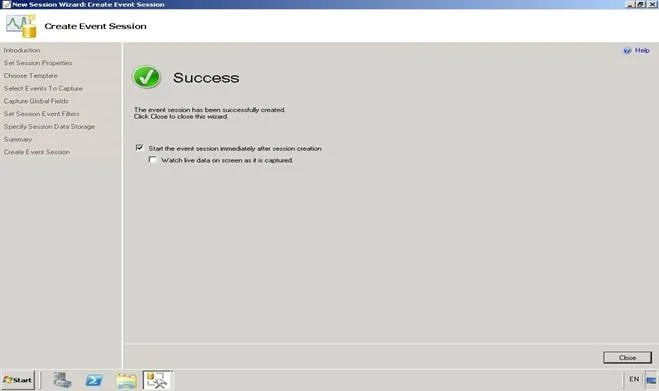
We will skip the Summary Page and click Finish >
To complete the New Session Wizard we can opt to Start the event session immediately after session creation and watch live data; click Close.
Create Event Session
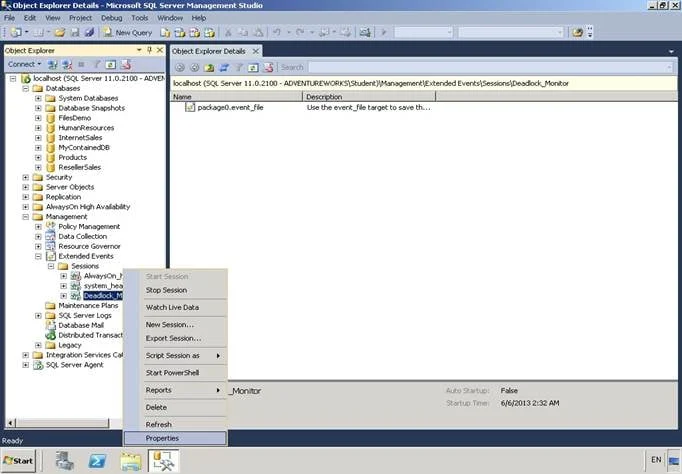
Once completed your new session will appear in Object Explorer.
Step 9
Right click the session and select Properties.
As you can see from the options available we can Start and Stop Session, Watch Live Data and Start Powershell.
Right Click Session Properties
Session Properties
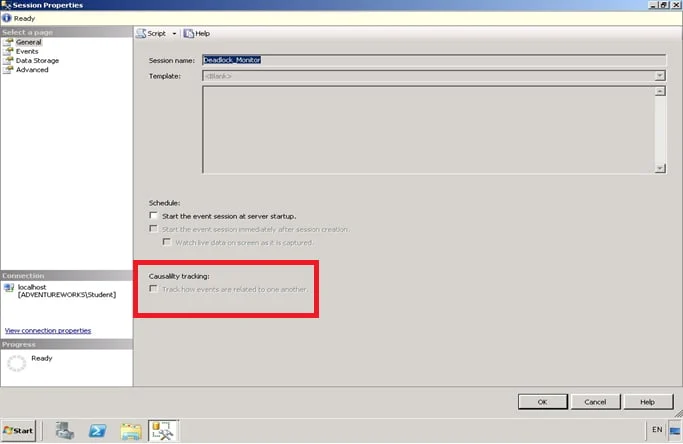
On the General page again we can schedule startup options and also configure Causality tracking.
Causality tracking, when enabled will track how events are related to one another; this is when one task causes work to be done by another task.
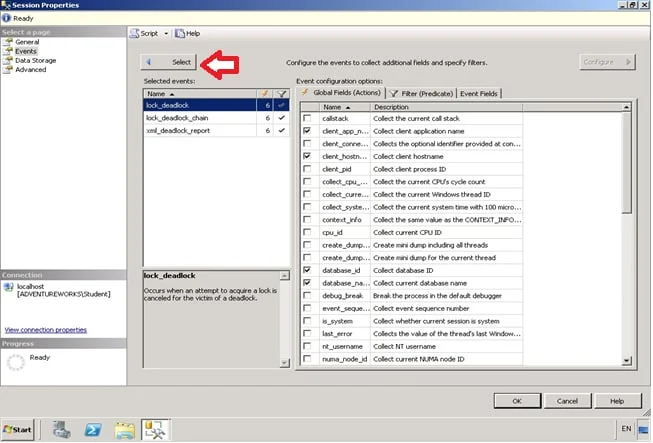
Step 10
On the Events page we can add in new events and click on Configure to manage settings relating to fields and filters.
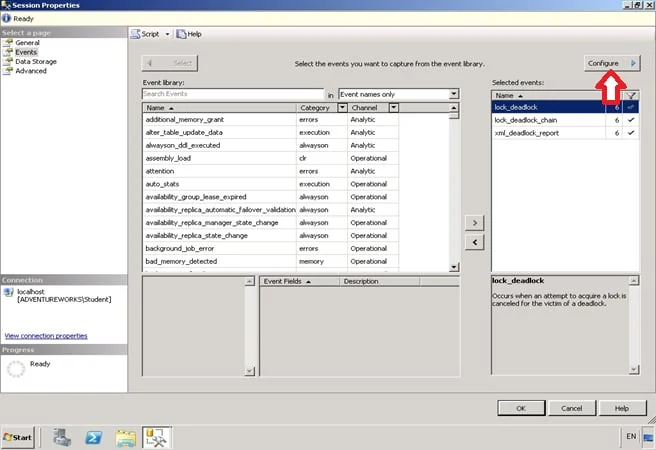
Session Properties: Configure
Session Properties: Select
Event configuration enables reconfiguration, enhancement of the Global Fields, Filter and Event Fields options.
What we have to keep in mind is that should we add in additional fields, more than is maybe necessary, this will contribute to an overhead in processing.
Once completed click on Select
Next we can look at the Data Storage page.
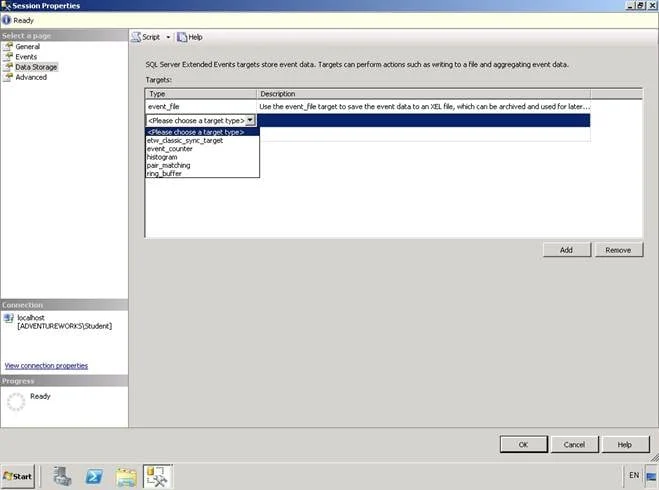
Data Storage
SQL Server lets you save your session events in a number of formats:
- etw_classic_sync_target: outputs events in an Event Tracing for Windows (ETW) format.
- event_counter : outputs events to memory in order to track the number of times an event has occurred during a session.
- event_file : outputs events to a file saved to a folder on a disk.
- histogram : outputs events to memory in order to group and count events based on fields or actions.
- pair_matching : outputs events to memory in order to track events that don’t have a corresponding event based on the target configuration.
- ring_buffer : outputs events to memory in order to track a limited amount of event data based on the target configuration.
Click OK to close down session propertries.
Step 11
Now let’s look at watching live data. Right click the session and select Watch Live Data; an extra Tab will appear connected to the session and instance of SQL Server.
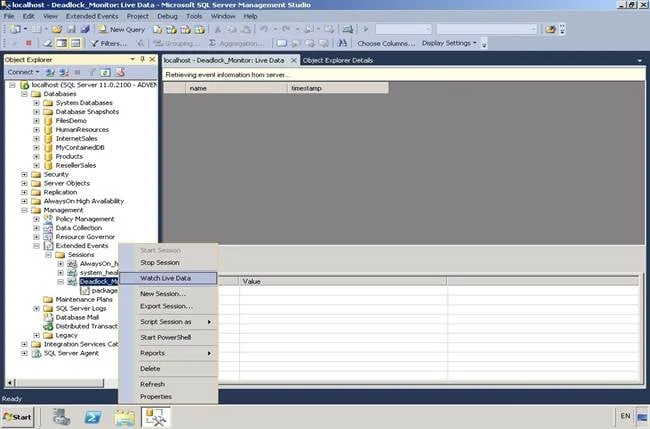
Watch Live Data
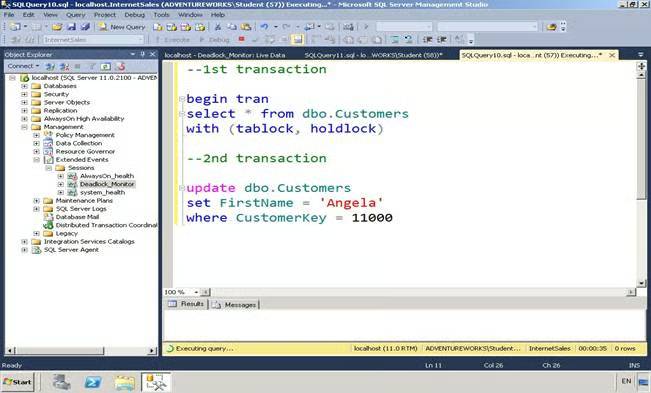
I have created a simple deadlock for demonstration against the Internet Sales database using the following code, which was executed in two query connections:
- 1st transaction executed in query connection one – 1st transaction then executed in query connection two
- 2nd transaction executed in query connection two – 2nd transaction executed in query connection two
Deadlock_Monitor
Four events have been captured; let us first look at the xml_deadlock_report event. To view the xml report double-click on the field xml_report.
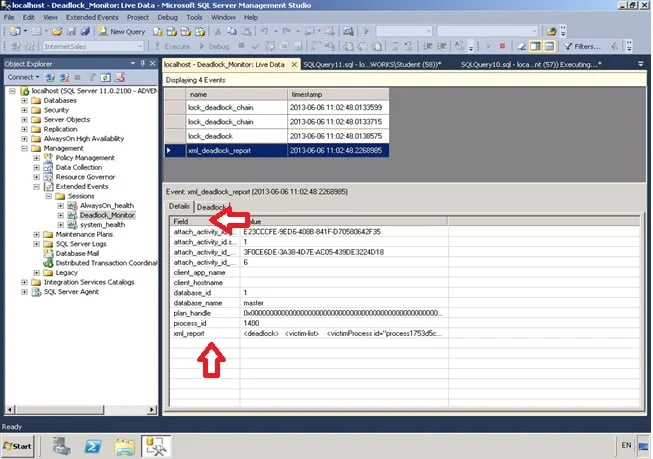
xml_deadlock_report
For a graphical representation select the Deadlock tab, we can then ascertain the T-SQL statement being executed, the process chosen as the deadlock victim and the request/owner mode for locks.
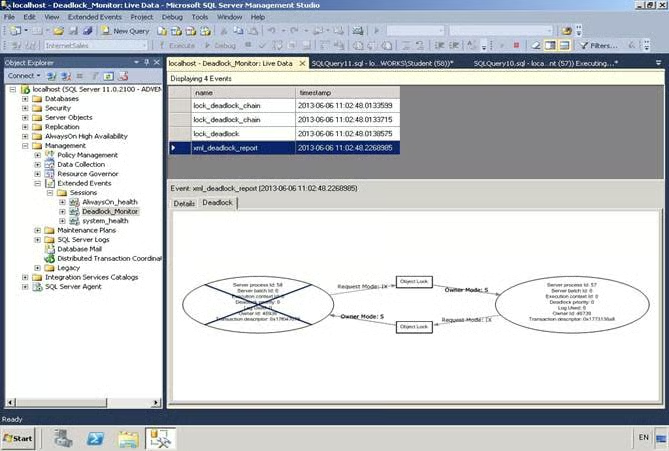
Localhost- Deadlock_Monitor: Live Data
Now let us take a look at the other events in the Deadlock_Monitor session that can help us drill down further into the deadlock issues.
- lock_deadlock event can be used to identify the deadlock victim. This event is raised whenever the request to acquire a lock is cancelled and this has been chosen as the deadlock victim.
- lock_deadlock_chain can be used to identify the objects involved in the deadlock and if we have any performance issues in the application due to deadlocks.
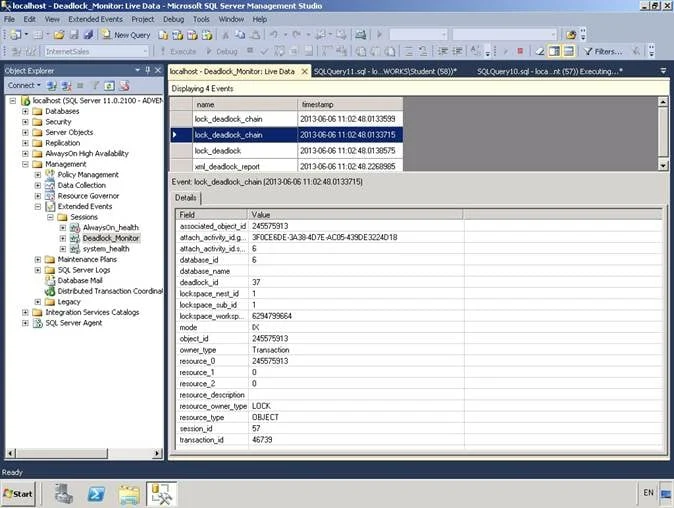
Deadlock_Monitor session
Extended Event session demonstration complete.
Start Using the New DBA Power Tool
Using Extended Events in SQL Server 2012 to monitor such issues as deadlocks provides a DBA with a simple and straightforward process for gathering data to aid in the troubleshooting and fact finding process.
We no longer have to work out how to extract Extended Event information using complex T-SQL statements and instead can use a tool built into SSMS, which should eliminate the reasons why many DBAs in the past have not used Extended Events.
A DBA now has everything to set up, control and maintain Extended Events.
Angela Cataldo works for Firebrand Training as a subject matter expert and instructor for SQL Server and System Centre. For over 10 years Angela specialized in SQL Server, delivering training and consultancy services to a number of companies throughout the UK and Europe guiding and mentoring customers to follow Microsoft Best Practice and assist in their understanding and adoption of SQL innovative features.