


Introduction
SQL Server 2005 includes a banded reporting tool and engine called SQL Server Reporting Service (SSRS). Developing reports in SSRS is similar to report building in Crystal or Microsoft Access. Reports can be viewed in a web browser, exported to a file, or embedded into a Windows form application.
Last month’s article covered SQL Server Reporting Service installation and basic architecture. This month we will begin creating reports using the SQL Server Business Intelligence Development Studio (BIDS).
BIDS
The SQL Server Business Intelligence Development Studio is a Visual Studio tool for creating reports. Reports created on your local machine using BIDS can be deployed to any Reporting Server. In this article, both SSRS and BIDS will be running on the local host. To open BIDS, click Start, Programs, Microsoft SQL Server 2005, and SQL Server Business Intelligence Development Studio. Once open, go to the top of the program and select File, New, Project, and the “New Project” dialog box show below should appear.
Report Server Project Wizard
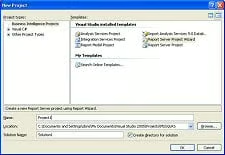
For this first example, we will use a wizard to create the report. In the top pane, select “Business Intelligence Projects” as the project type, and “Report Server Project Wizard” as the template. In the bottom pane, set the location to a directory of your choice. There are two Name text boxes, one for the solution, and one for the project. If you are new to Visual Studio, think of a Solution as a super container, capable of holding one or more related projects. A Project container lives inside a solution, and holds the actual reports we will create and any supporting files needed. Notice it is not asking for the name of our Reporting Server. That will come later, and regardless of what Solution or Project a report is created in, it can be deployed to any reporting server, or to multiple Reporting Servers, such as a test server and a production server. Click OK.
The “Welcome to the Report Wizard” dialog box should appear. Click Next.
This next screen, “Select the Data Source,” is where we will attach a database to the report. In this example, we will be attaching to Adventure Works on the local machine. Keep the defaults of DataSource1 as the name and Microsoft SQL Sever as the type. Click the Edit button in the middle right of the form.
A “Connection Properties” dialog box should appear. Enter the name of your SQL server and leave the default of “Use Windows Authentication” as the logon choice. Select Adventure Works as the database name. Click the test connection button, a success message should appear. If not, check your permissions before proceeding. Click OK.
You should be returned to the “Select the Data Source” screen and the connection string should be filled in with something similar to the this: “Data Source=.;Initial Catalog=AdventureWorks”. Click Next.
This will take us to the “Design the Query” screen. From here, we will create a select statement to populate into our report. Click the “Query Builder” button to enter the graphical builder tool.
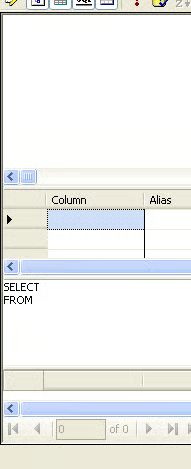
If your Query Builder shows only two empty panes, click the “Generic Query Designer” button in the top left. There should be four panes as shown below.
Click the “Add Table” icon located in top right. When the “Add Table” screen appears, select “Contact (Person)”, then click Add, then close.
We should now be back in the “Query Builder.” Select First Name, Last Name, and email address, and then click OK.
The “Design the Query” screen should now be filled in with the statement “SELECT FirstName, LastName, EmailAddress FROM Person.Contact”. Click next.
On the “Select Report Screen,” keep the default of tabular and click Next.
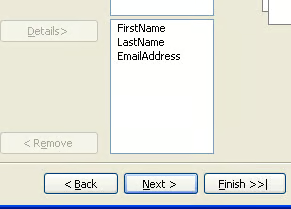
You should now be on the “Design the Table” screen. Here we could add grouping to the report. In this example however, there will not be any groups or subgroups. All the data will be returned in one unbroken stream. With the “First Name” selected in the “Available Columns,” click the Details button. Repeat this for each of the remaining fields then. The screen should look like the example below.
Click Next.
Pick a Table Style of your choice and click Next.
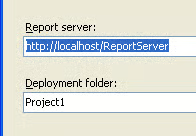
On the Deployment Location screen, your local web server should be listed like the image below. Click Next.
On this last screen, give the report a name and click finish. You should now be in a layout design screen.
To see how the actual report will appear to an end user, click the Preview tab.
Deploying
For an end user to see your report, it must be deployed to a Reporting Server. During the setup wizard for this report, we specified a Reporting Server name, which was saved with the project, but the report was not actually deployed. To deploy it now, we will use the “Solution Explorer.” The Solution Explorer window should be visible in the top right corner of the screen. If its not, from the top menu select View, Solution Explorer. Once Solution Explorer is visible, expand the reports folder, the new report should be visible. Right click it and select Deploy. After a few seconds, a Deploy Started message should appear at the bottom of the screen then go away. The report has now been copied from the developing tool, BIDS, to the report server.
Browser
To view the report from an internet browser, enter the URL “http://localhost/reports”. This may take awhile the first time. The browser should be redirected to web page looking like the image below.

Click the Project1 folder, then the new report should be listed. Click it to run the report.
Conclusion
This wizard based example demonstrates how easy it is to generate reports using BIDS. Once a report is created, it must be deployed to a Report Server to be viewed by end users. BIDS has built in utilities for accomplishing this move. For the little bit of work we did, there is now a report that can be browsed to, viewed, and saved as an Excel sheet or PDF. In next month’s article, we will explore creating reports from scratch, without the wizard, as well as other methods for accessing the report once it is deployed.