


This article will explore various SQL methods for producing pivot style reports.
Introduction
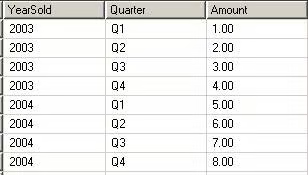
A pivot is a data mining option typically used to transform large amounts data into a condensed list. Pivot style reports display data in a grid along a vertical and horizontal axis. Financial and managerial reports are the examples usually sited. The pivot style report pictured below displays sales data; with the Year of the sales running along one axis and the Quarter the sales was made running along the other. The sales amount is the sum of all dollars for the particular year and quarter.
![]()
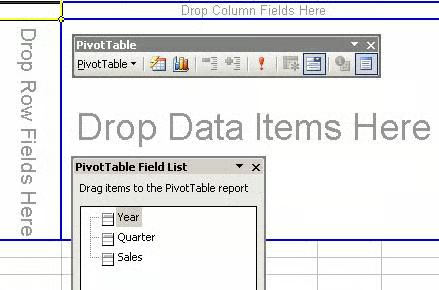
For Microsoft Office users, Pivot reports and tables are standard options. In Microsoft Excel, there is a drag and drop wizard that walks a user though all the steps needed to create a pivot table. The final result is the gird displayed in the first image. Unlike a simple pivot report, Excel Pivot Tables can have their Column and Rows dynamically changed by dragging the desired column to the correct axis.
In Microsoft Access, there is a wizard for creating pivot queries, called “Cross tabs.” The wizard asks which columns should be on the axis, then auto-generates the code needed. Access creates pivots by using the special key word TRANSFORM:
TRANSFORM Sum(SALES.AMOUNT) AS SumOfAMOUNT
SELECT SALES.YEAR, Sum(SALES.AMOUNT) AS [Total Of AMOUNT]
FROM SALES
GROUP BY SALES.YEAR
PIVOT SALES.QUARTER;
Unfortunately, there is no wizard for producing T-SQL Pivots. In SQL 2000, pivot style reports, called “Cross-Tab Reports” can be created using the CASE keyword. In SQL 2005, CASE can be used, or there is a new keyword, PIVOT.