


A busy SQL Server instance with tens or hundreds of databases, for example, a SharePoint server used by the entire company, often has its database files spread across multiple physical drives to help with the I/O performance. However, as more and more databases are added to the server, the I/O activity among the drives can become unbalanced. One drive could be taking a heavier workload than others and become the performance bottleneck. When this sort of I/O problems occur, you need to monitor the activity of all the drives on Performance Monitor, compare their workloads and identify the bottlenecks.
Some of the perfomance counters regarding disk I/O are listed below.
LogicalDisk\% Disk Time
LogicalDisk\% Disk Read Time
LogicalDisk\% Disk Write Time
LogicalDisk\Avg. Disk Queue Length
LogicalDisk\Avg. Disk Read Queue Length
LogicalDisk\Avg. Disk Write Queue Length
LogicalDisk\Disk Bytes/sec
PhysicalDisk\% Disk Time
PhysicalDisk\Avg. Disk Queue Length
PhysicalDisk\Avg. Disk Read Queue Length
PhysicalDisk\Avg. Disk Write Queue Length
From the performance data, if a drive is busy for a much higher percentage of time or its disk queue length is greater than 1.5 * (number of spindles), you might want to move some database files from the drive to other drives with a lighter workload, or get a new drive to allieviate the I/O pressure. To decide which database files to move, you need to examine the activity of each database file so you can make a reasonable estimate on how the drives will perform after the reorganization. Each database gets hit differently. It is not necessary that the bigger or faster-growing databases are busier. In this article, I will show you a simple report for the I/O statistics of each database file, including reads, writes, and time spent waiting for reads and writes.
In SQL Server 2005 and SQL Server 2008, a new dynamic management function sys.dm_io_virtual_file_stats is available. This function accepts two parameters, a database id and a file id. When both parameters are null, then this function returns I/O statistics for all data and log files.
select *
from sys.dm_io_virtual_file_stats(NULL, NULL)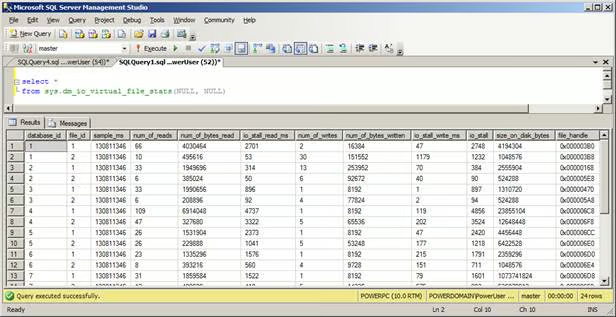
Figure 1
As shown in Figure 1, the I/O statistics for all the data and log files has been returned. The columns regarding I/O activity are described as follows.
sample_ms
Number of milliseconds since the computer was started. This column can be used to compare different outputs from this function.
num_of_reads
Number of reads issued on the file.
num_of_bytes_read
Total number of bytes read on this file.
io_stall_read_ms
Total time, in milliseconds, that the users waited for reads issued on the file.
num_of_writes
Number of writes made on this file.
num_of_bytes_written
Total number of bytes written to the file.
io_stall_write_ms
Total time, in milliseconds, that users waited for writes to be completed on the file.
io_stall
Total time, in milliseconds, that users waited for I/O to be completed on the file.
However, the database_id and file_id columns in the result set don’t provide a direct link from the I/O statistics to the file name or path. We need to join the table returned by sys.dm_io_virtual_file_stats with the sys.master_files catalog view to find out on which drive the files reside. If you concluded from the performance data that writing causes the bottleneck, you can sort the result set by num_of_bytes_written to find out which file is written the most.
select db_name(mf.database_id) as database_name, mf.physical_name,
left(mf.physical_name, 1) as drive_letter,
vfs.num_of_writes, vfs.num_of_bytes_written, vfs.io_stall_write_ms,
mf.type_desc, vfs.num_of_reads, vfs.num_of_bytes_read, vfs.io_stall_read_ms,
vfs.io_stall, vfs.size_on_disk_bytes
from sys.master_files mf
join sys.dm_io_virtual_file_stats(NULL, NULL) vfs
on mf.database_id=vfs.database_id and mf.file_id=vfs.file_id
order by vfs.num_of_bytes_written desc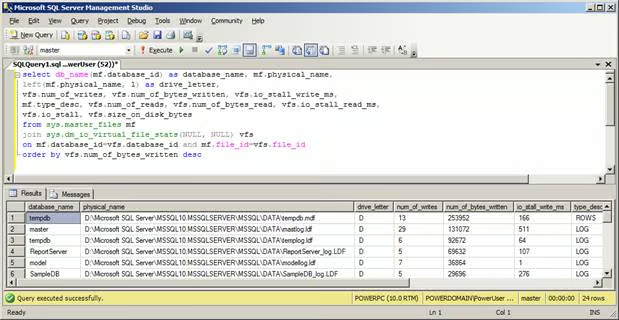
Figure 2
As shown in Figure 2, the data file of tempdb is being written to the most. If the performance data showed that the drive D: is the write bottleneck, then we can consider moving tempdb to another drive, or adding a new drive for tempdb (having tempdb on a separate drive is Microsoft recommended).
It would also be helpful to know the total read and write activities of a logical drive by running the following statement.
select left(mf.physical_name, 1) as drive_letter, sample_ms,
sum(vfs.num_of_writes) as total_num_of_writes,
sum(vfs.num_of_bytes_written) as total_num_of_bytes_written,
sum(vfs.io_stall_write_ms) as total_io_stall_write_ms,
sum(vfs.num_of_reads) as total_num_of_reads,
sum(vfs.num_of_bytes_read) as total_num_of_bytes_read,
sum(vfs.io_stall_read_ms) as total_io_stall_read_ms,
sum(vfs.io_stall) as total_io_stall,
sum(vfs.size_on_disk_bytes) as total_size_on_disk_bytes
from sys.master_files mf
join sys.dm_io_virtual_file_stats(NULL, NULL) vfs
on mf.database_id=vfs.database_id and mf.file_id=vfs.file_id
group by left(mf.physical_name, 1), sample_ms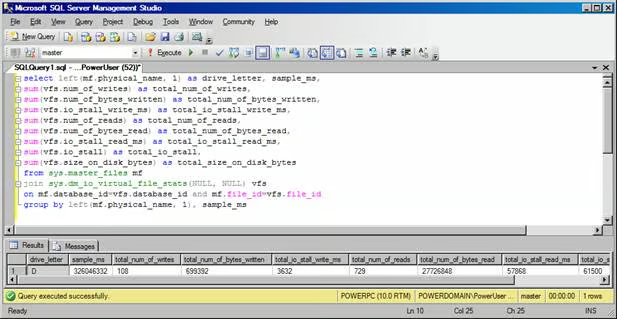
Figure 3
The output is shown in Figure 3. You can compare these total values with the performance data to confirm the imbalance of drive workloads. You can also use the total values to estimate how the drives will behave after file moves. For example, in our example, if we decide to move the tempdb data file off the drive D:, we can simply deduct the num_of_bytes_written of the tempdb data file from the total_num_of_bytes_written of drive D:, to estimate the total number of bytes that will be written in the same sampling period after the move.
In SQL Server 2000, the sys.dm_io_virtual_file_stats function doesn’t exist. You can, however, use the fn_virtualfilestats function. This function doesn’t accept NULL as a valid parameter value. Therefore, you have to use a cursor to iterate through all database files.
DECLARE @DBID smallint
DECLARE @FILEID smallint
DECLARE @DBNAME sysname
DECLARE @FILENAME nvarchar(260)
CREATE TABLE #FileIOStats
(name sysname,
filename nvarchar(260),
drive_letter char(1),
NumberReads bigint,
NumberWrites bigint,
BytesRead bigint,
BytesWritten bigint,
IoStallMS bigint)
DECLARE ALLFILES CURSOR FOR
SELECT dbid, fileid, [name], [filename] FROM [master].[dbo].[sysaltfiles]
OPEN ALLFILES
FETCH NEXT FROM ALLFILES INTO @DBID, @FILEID, @DBNAME, @FILENAME
WHILE (@@FETCH_STATUS = 0)
BEGIN
                INSERT INTO #FileIOStats
                SELECT @DBNAME, @FILENAME, left(@FILENAME, 1), NumberReads, NumberWrites, BytesRead, BytesWritten, IoStallMS
                FROM ::fn_virtualfilestats(@DBID, @FILEID)
                FETCH NEXT FROM ALLFILES INTO @DBID, @FILEID, @DBNAME, @FILENAME
END
CLOSE ALLFILES
DEALLOCATE ALLFILES
SELECT * FROM #FileIOStats
DROP TABLE #FileIOStats
As you can see, it is much simpler and easier to retrieve the report in SQL Server 2005 and 2008.
Conclusion
In this article, we have shown you how to produce a simple database file I/O report that helps resolve disk I/O bottleneck. This report can be used to identify the files to move off busy drives and to estimate the I/O activities after file moves.