


Introduction
Statistics refers to the statistical information about the distribution of values in one or more columns of a table or an index. The SQL Server Query Optimizer uses this statistical information to estimate the cardinality, or number of rows, in the query result to be returned, which enables the SQL Server Query Optimizer to create a high-quality query execution plan. For example, based on these statistical information SQL Server Query Optimizer might decide whether to use the index seek operator or a more resource-intensive index scan operator in order to provide optimal query performance. In this article series, I am going to talk about statistics in detail.
Basics of Statistics
SQL Server Query Optimizer uses statistics to estimate the distribution of values in one or more columns of a table or index views, and the number of rows (called cardinality) to create a high-quality query execution plan. Often statistics are created on a single column but it’s not uncommon to create statistics on multiple columns.
Each statistics object contains a histogram displaying the distribution of values of the column (or of the first column in the case of multi-column statistics). Multi-column statistics also contains a correlation of values among the columns (called densities), which are derived from the number of distinct rows or the column values.
There are different ways you can view the details of the statistics objects. For example, as shown in the query below, you can use the DBCC SHOW_STATISTICS command. DBCC SHOW_STATISTICS shows the header, histogram, and density vector based on data stored in the statistics object.
--This shows header, histogram, and density vector based on data   stored in the statistics object
DBCC SHOW_STATISTICS("SalesOrderDetail", NCI_SalesOrderDetail_ProductID);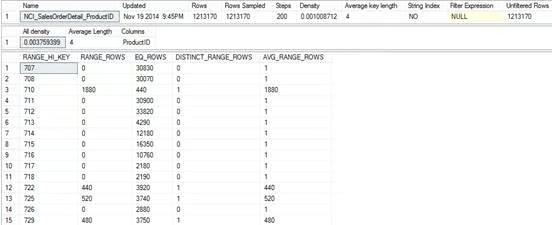
--This only shows histogram based on data stored in the   statistics object
DBCC SHOW_STATISTICS("SalesOrderDetail", NCI_SalesOrderDetail_ProductID)
WITH HISTOGRAM;
You can also view the statistical information by going to the properties page of the statistics object in SQL Server Management Studio as shown below:
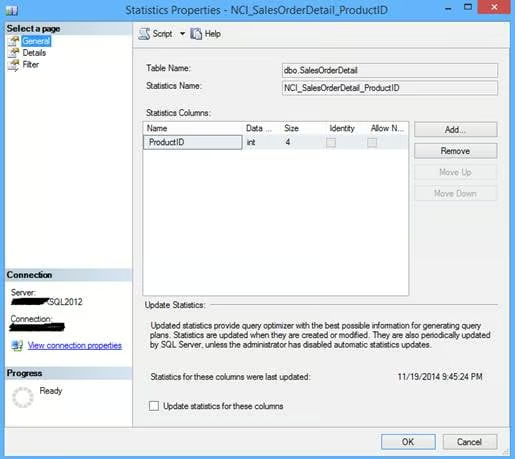
Statistics Properties: General
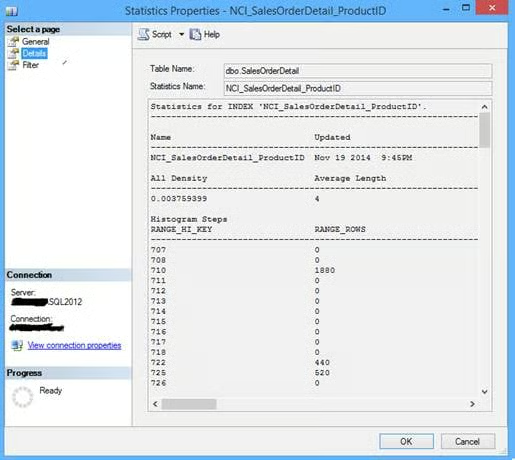
Statistics Properties: Details
The value for all_density (1 / number of distinct values for a column) ranges from 0.0+ to 1, which indicates selectivity (duplicates), 0.0+ being highly selective with less duplicates whereas 1 is less selective with a high number of duplicates; as a rule of thumb, the lesser the better. This actually helps SQL Server Query Optimizer to decide whether to use Index Seek or Index Scan.
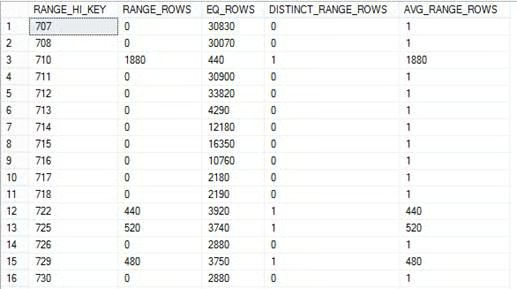
The histogram captures the frequency of occurrence for each distinct value in the first key column of the statistics object. SQL Server Query Optimizer creates the histogram by sorting the column values, computing the number of values that match each distinct column value and then aggregating the column values into a maximum of 200 contiguous histogram steps.
Each histogram step includes a range of column values followed by an upper bound column value, which includes all possible column values between boundary values (excluding the boundary values themselves). The lowest of the sorted column values is the upper boundary value for the first histogram step.
- RANGE_HI_KEY – This is also called a key value and represents the upper bound column value for a histogram step.
- RANGE_ROWS – This represents the estimated number of rows whose column value falls within a histogram step, excluding the upper bound.
- DISTINCT_RANGE_ROWS – This represents the estimated number of rows with a distinct column value within a histogram step, excluding the upper bound.
- EQ_ROWS – This represents the estimated number of rows whose column value equals the upper bound of the histogram step.
- AVG_RANGE_ROWS (RANGE_ROWS / DISTINCT_RANGE_ROWS for DISTINCT_RANGE_ROWS > 0) – This represents the average number of rows with duplicate column values within a histogram step, excluding the upper bound.
When to Create or Update Statistics
When to Create Statistics
Often columns being used in JOIN, WHERE, ORDER BY, or GROUP clauses are good candidate to have up-to-date statistics on them. Though the SQL Server Query Optimizer creates single column statistics when the AUTO_CREATE_STATISTICS database property is set to ON or when you create indexes on the table or views (statistics are created on the key columns of the indexes), there might be times when you need to create additional statistics using the CREATE STATISTICS command to capture cardinality, statistical correlations so that it enables the SQL Server Query Optimizer to create improved query plans.
When you find a query predicate containing multiple columns with cross column relationships and dependencies you should create multi-column statistics. These multi-column statistics contain cross-column correlation statistics, often referred to as densities, to improve the cardinality estimates when query results depend on data relationships among multiple columns.
When creating multi-column statistics, be sure to put columns in the right order as this impacts the effectiveness of densities for making cardinality estimates. For example, a statistic created on these columns and in order – Name, Age, and Salary. In this case, the statistics object will have densities for the following column prefixes: (Name), (Name, Age), and (Name, Age, Salary). Now if your query uses Name and Salary without using Age, the density is not available for cardinality estimates.
When to Update Statistics
Substantial data change operations (like insert, update, delete, or merge) change the data distribution in the table or indexed view and make the statistics goes stale or out-of-date, as it might not reflect the correct data distribution in a given column or index. SQL Server Query Optimizer identifies these stale statistics before compiling a query and before executing a cached query plan. The identification of stale statistics are done by counting the number of data modifications since the last statistics update and comparing the number of modifications to a threshold as mentioned below.
- A database table with no rows gets a row
- A database table had fewer than 500 rows when statistics was last created or updated and is increased by another 500 or more rows
- A database table had more than 500 rows when statistics was last created or updated and is increased by 500 rows + 20 percent of the number of rows in the table when statistics was last created or updated.
You can find when each statistics object of a database table was updated using the below query:
SELECT
        name   AS StatisticsName,
      STATS_DATE(object_id,   stats_id) AS StatisticsUpdatedDate
FROM sys.stats
WHERE OBJECT_NAME(object_id) = 'SalesOrderHeader'
ORDER BY name;
GO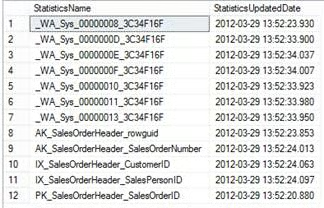
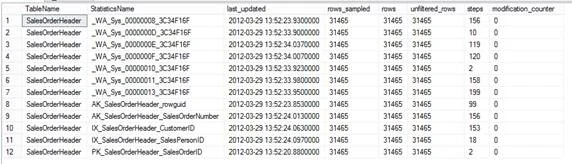
You can also use below query, which uses the dynamic management function (sys.dm_db_stats_properties) to retrieve statistics properties with further details; for example, modification_counter, which shows the total number of modifications on the leading statistics column (the column on which the histogram is built) since the last statistics update.:
SELECT
        OBJECT_NAME(stats.object_id) AS TableName,
        stats.name AS StatisticsName,
        stats_properties.last_updated,
        stats_properties.rows_sampled,
        stats_properties.rows,
        stats_properties.unfiltered_rows,
        stats_properties.steps,
        stats_properties.modification_counter
FROM sys.stats stats
OUTER APPLY sys.dm_db_stats_properties(stats.object_id, stats.stats_id) as   stats_properties
WHERE OBJECT_NAME(stats.object_id) = 'SalesOrderHeader'
ORDER BY stats.name;
Importance of Statistics in Query Performance
Let’s start understanding this with an example. Execute the below query to create a new database and set its AUTO_CREATE_STATISTICS and AUTO_UPDATE_STATISTICS properties to OFF so that automatic statistics creation and updating does not happen on the tables of this database. Next create a table and load data from the SalesOrderDetail table of the AdventureWorks database. I have loaded ten times of the data so that we can see the differences clearly.
CREATE DATABASE [StatisticsTest]
GO

ALTER DATABASE [StatisticsTest] SET   AUTO_CREATE_STATISTICS OFF
ALTER DATABASE [StatisticsTest] SET   AUTO_UPDATE_STATISTICS OFF
ALTER DATABASE [StatisticsTest] SET   AUTO_UPDATE_STATISTICS_ASYNC OFF
GO

USE   [StatisticsTest]
GO
CREATE TABLE [SalesOrderDetail](
        [SalesOrderID]   [int] NOT NULL,
        [SalesOrderDetailID]   [int] NOT NULL,
        [CarrierTrackingNumber]   [nvarchar](25)   NULL,
        [OrderQty]   [smallint] NOT NULL,
        [ProductID]   [int] NOT NULL,
        [SpecialOfferID]   [int] NOT NULL,
        [UnitPrice]   [money] NOT NULL,
        [UnitPriceDiscount]   [money] NOT NULL,
        [LineTotal]   money NOT NULL,
        [rowguid]   [uniqueidentifier] ROWGUIDCOL  NOT NULL,
        [ModifiedDate]   [datetime] NOT NULL,
) ON [PRIMARY]
GO

INSERT INTO [SalesOrderDetail]
SELECT * FROM   [AdventureWorks2008R2].[Sales].[SalesOrderDetail]
GO 10
Now let’s run these two queries and have a look on their execution plan. Notice the yellow exclamation mark on the “Table Scan” operator; this indicates the missing statistics. Further, notice between the “Actual Number of Rows” and “Estimated Number of Rows” that there is a huge difference. This means, obviously, the execution plan used for query execution was not optimal.
select * from [dbo].[SalesOrderDetail]
where   ProductID <= 800;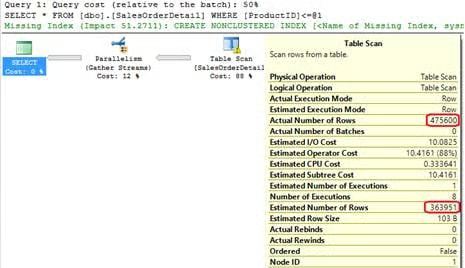
select * from [dbo].[SalesOrderDetail]
where   ProductID >= 800;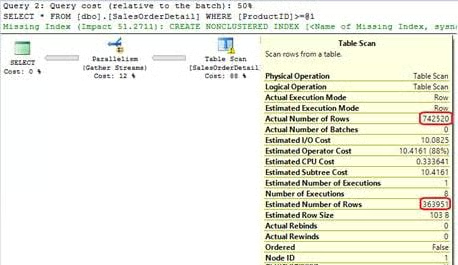
Now let’s create an index on the ProductID column, which will also create statistics on the ProductID with the below query:
CREATE NONCLUSTERED INDEX   [NCI_SalesOrderDetail_ProductID]
ON   [dbo].[SalesOrderDetail] ([ProductID])
GO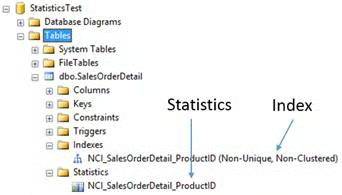
Now if you re-execute the above same queries, you will notice two things. First, there is no warning for missing statistics and second “Actual Number of Rows” and “Estimated Number of Rows” are the same or very close to each other:
select * from [dbo].[SalesOrderDetail]
where   ProductID <= 800;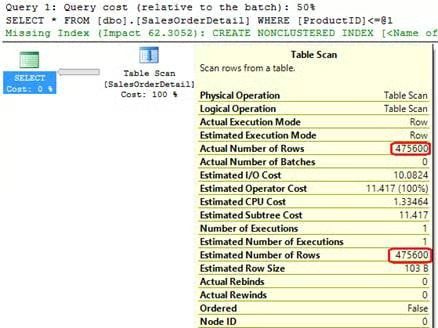
select * from [dbo].[SalesOrderDetail]
where   ProductID >= 800;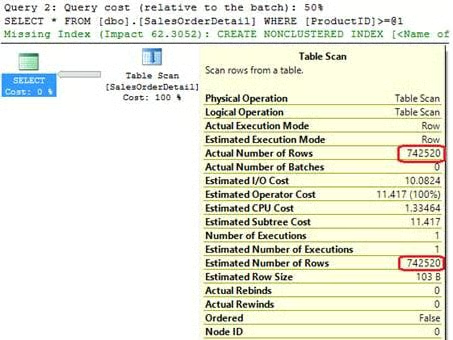
Conclusion
In this article I discussed the basics of statistics and why it is needed. I also talked about when it needs to be created or updated and how it looks. In the next article of the series, I am going to discuss how performance gets impacted because of missing and out-of-date statistics, how statistics are managed in SQL Server, what are filtered statistics and what is new in SQL Server 2012 related to statistics.
Resources
Statistics Used by the Query Optimizer in Microsoft SQL Server 2008