


Introduction
Microsoft Power BI is a cloud based self-service BI solution for the enterprise. Power BI provides capabilities that can be leveraged by people with all level of skills including data analyst, power users, business users, data stewards and folks from the IT department.
I’ve discussed Power BI in detail in the last couple of articles and demonstrated how you can create reports or dashboards on the data you have. Over a period of time, you need to refresh the data to reflect the current state or use a mechanism to query data interactively. In this article I am going to demonstrate how you can use Analysis Services connector to query your on-premise data from an Analysis Services instance in Power BI reports or dashboards interactively. Subsequently, in the next article I will talk about scheduling data refresh for other types of data sources.
Understanding Power BI – Analysis Services Connector
Power BI Analysis Services connector lets you query data from on-premises SQL Server Analysis Services instance interactively (as of this writing only tabular models are supported, although multi-dimensional support is expected to come soon). Analysis Services connector is a client or proxy agent that you need to install on any of the machines in the on-premises domain (recommended to install at the same machine on which the Analysis Services instance is running for better performance and to avoid latency). Analysis Services facilitates behind-the-scenes communication from a user in Power BI to your on-premises Analysis Services instance and back to Power BI in a secure and quick way. You can download and install this connector from here.

Understanding Power BI
If you have more than one Analysis Services instance to connect data, you’ll need to install and configure one Analysis Services Connector per instance. Installation of Analysis Services Connector is usually done by an administrator who has Server Administrator permission on the Analysis Services instance although once configured, it can be used by any user who has access to the Analysis Services database.
Getting Started with Power BI – Analysis Services Connector
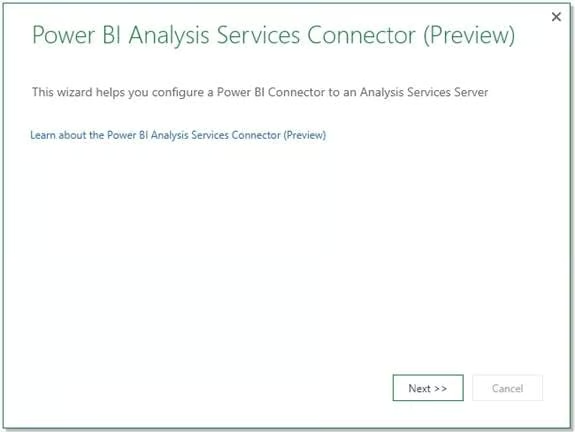
Once installed, a user with Server Administrator permission on an Analysis Services instance can configure the Analysis Services connector. On the first screen of the wizard of the Analysis Services connector, click on the Next >> button.
Power BI Analysis Services Connector Wizard
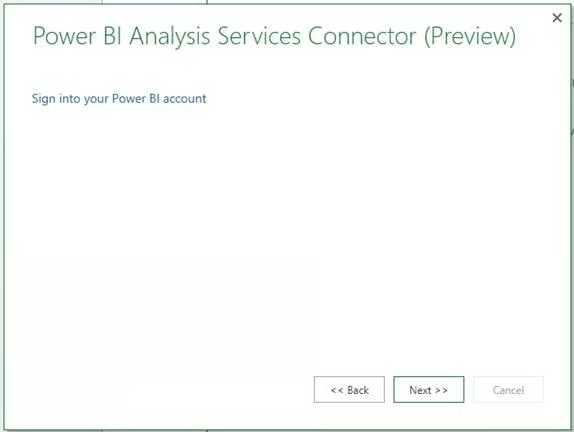
On the next screen of the wizard, you need to connect to the Power BI account where you want to use data, which should come from the on-premises Analysis Services.
Sign into Your Power BI Account
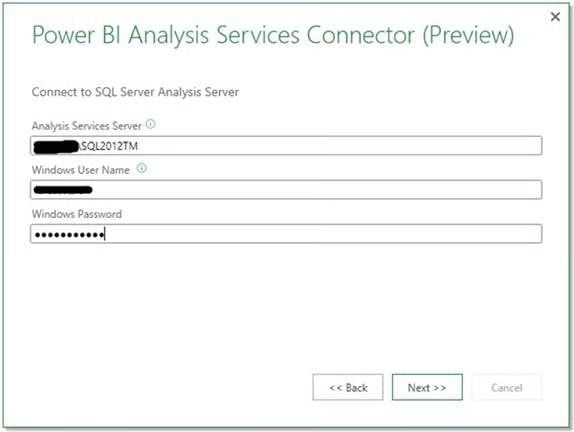
On the next screen of the wizard, you need to specify the Analysis Services Server name; for the default instance you can simply specify the machine name and for the named instance you need to specify machine name\instance name.
Next specify the Windows User Name that has Server Administrator permission on the specified Analysis Services instance, followed by the respective password for the specified windows user name.
Login Screen
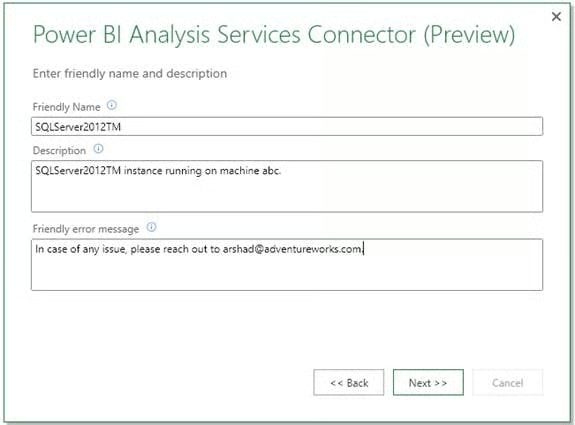
Now, on the next screen of the wizard, you can specify the Friendly Name for the connection so that Power BI users can easily identify it while browsing on the Power BI site. You can also specify a description with more details about the connection to help Power BI users to get to know more about the connection. With Friendly error message, you can specify a customized error message to be shown when a Power BI user is not able to connect from the Power BI to the on-premises Analysis Services instance that you have configured.
Friendly Name and Description
On the final screen of the wizard, you should be able to see the configuration status as shown in the figure below.
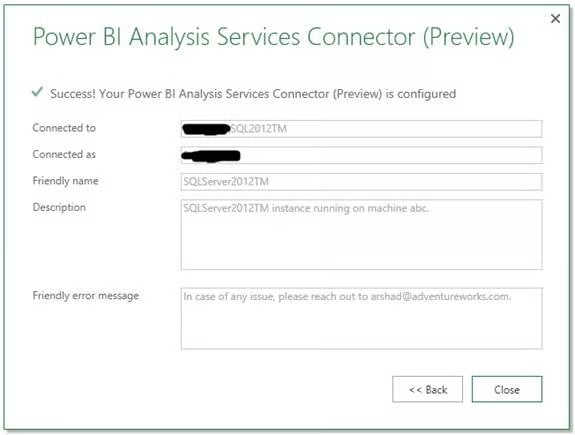
Configuration Status
Once installed and configured, it enables you, with Power BI, to connect to an on-premises Analysis Services instance and query it interactively.
To get started with it, go to the Power BI site, click on the Get Data link and then click on SQL Server Analysis Services from the list on the left pane as shown below.
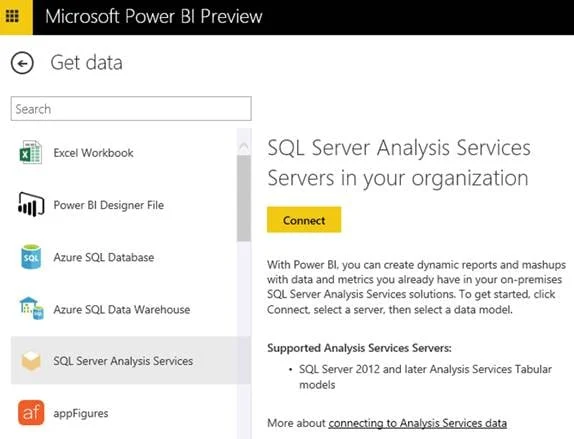
Power BI Site
Clicking on the Connect button in the above screen will take you to a page where you can see all the configured Analysis Services servers that are registered with Power BI. You can search for your configured server by using the available Search box on the top.
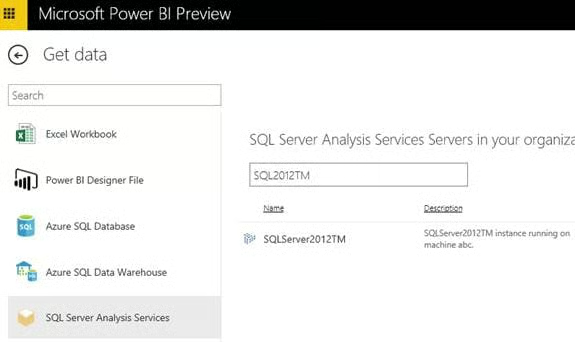
SQL Server Analysis Services Servers
Now click on the identified Analysis Services server in the above screen, and it will connect to the respective server and will display all the models or cubes available, if you have at least read permissions on them. (For this demonstration, I used AdventureWorks Tabular Model SQL Server 2012 sample, which is available here for download). You can select the cube that you want to use and click on the Connect button.
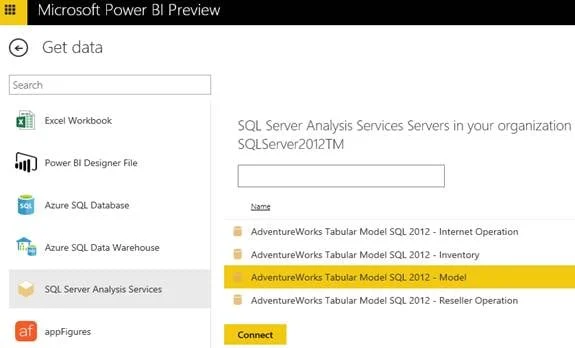
Select the Cube
Clicking on the Connect button will create a dataset, which you can verify under the Datasets tree view. Please note, the Analysis Services connector allows you to have a live connection to the on-premise Analysis Services server and is always up to date. In other words, you don’t need to setup or schedule a data refresh cycle for the data coming from the on-premises Analysis Services instance when using Analysis Services connector.
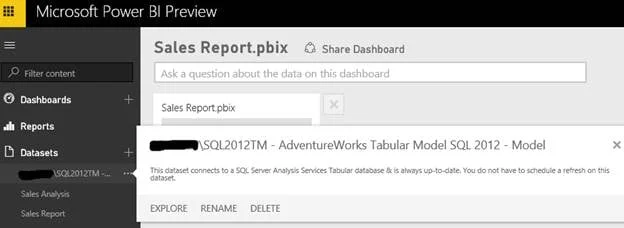
Datasets
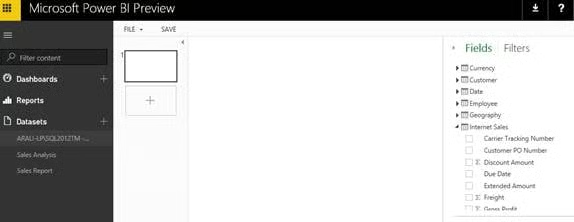
With the available dataset, you can start creating reports. For that, click on the dataset and you will see the data model on the right as shown below. Now you can drag and drop fields from the Fields list on the report canvas; Power BI will appropriately pick up the visualization type and will show it. In case you want to change visualization, click on the tiny Change Visualization type icon on the right top of the selected visualization and change to any available other visualization.
You can also create multi-page reports here, as shown below, by adding more pages to the report.
Multi-page Reports
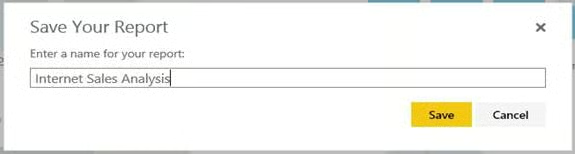
Once you are done with creating reports you can save the report or a copy of the report by clicking on the SAVE link in the menu and by giving an appropriate name, as shown below.
Save Your Report
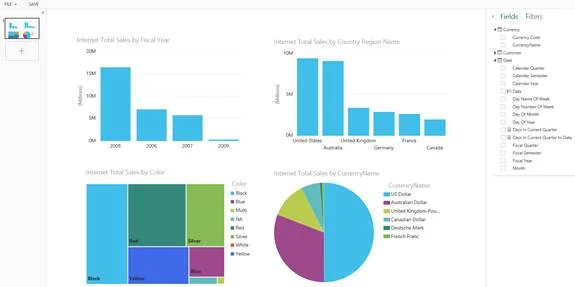
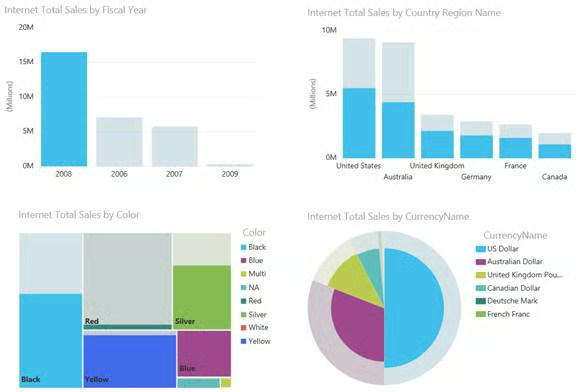
Power BI includes a rich set of visualizations or charts for better insight and you can use them to analyze your dataset from different angles or views. For example, I created this simple but nice looking report in few minutes, based on the dataset I created earlier on the data from on-premises Analysis Services.
Simple Report
The good part of Power BI Visualizations or charts is, they are linked together in the report page and hence for deeper insight, you can click or filter on any of the charts and the rest will be updated to reflect the selection. For example, as shown below, I clicked on the year 2008 in the first bar chart and as you can see the other three charts have been refreshed to show or highlight only data for the year 2008.
Refreshed Charts
Security While using Analysis Services Connector
A person with Server Administrator permissions configures the Analysis Services Connector and from then on anyone with access to the Analysis Services instance (with their role membership on that instance) can access and use data from Analysis Services. Power BI uses the EffectiveUserName attribute in the connection string to pass on the context of the user who is creating the report and Analysis Services Connector in turn validates and uses the same to query the data from Analysis Services by way of impersonation (please note, credentials of the person who configured the Analysis Services Connector is not used while querying the data from the Analysis Services) and returns the only data on which the user has access to.
As of this writing, when a dashboard is shared with others, others will indirectly inherit all the permissions from the original report author (in essence, when an author shares a dashboard he\she actually shares the data view he\she has access to). For example, consider person A creates a dashboard and shares it with person B, in this case person B will be able to see all the data that person A can see (even though person B directly might not have permission to access the data).
Data Refresh – Queries Being Sent to Analysis Services
Before I begin this discussion, let me talk about a Power BI Report and a Power BI Dashboard.
You can create a Power BI report based on data from a single data source. This report can contain multiple pages, each page having multiple report items or charts control to show the data.
A dashboard is a place where you pin your report items and share it with others. Typically a dashboard contains multiple report items; each of these report items might come from different reports and hence might get data from separate data sources. At the same time, a single report item can also be used in multiple dashboards.
When you click or interact with a Power BI report, Field list or Filter (like clicking on a chart, selecting a filter, or adding a new field to the report, etc.), Power BI generates equivalent DAX queries and sends queries to Analysis Services for execution whereas for the dashboard, Power BI issues queries to Analysis Services approximately every 10 minutes to keep the dashboard up-to-date.
Please note, Power BI and Power BI Analysis Services connector is in its preview stage right now; features mentioned in this article might change in the final release.
Conclusion
Analysis Services connector lets you query data from on-premises SQL Server Analysis Services instance interactively from the Power BI site. In this article, I discussed Analysis Services connector, how to install and configure it and how to use it for querying data directly from an on-premises Analysis Services instance in an interactive manner and how to create Power BI reports or dashboards.
Resources
Microsoft Power BI Analysis Services Connector (Preview)
Getting Started with Power BI Designer
Understanding Microsoft Power BI – Self Service Solutions